Question 38 of 42
Q.(a) The energy of the electron in the first Bohr orbit is −13.6 eV. Calculate Rydberg's constant. [1]
(b) Draw the energy level diagram for hydrogen atom. Mark the transitions corresponding to the series lying in the ultraviolet region and visible region. [1+1]
OR
(a) Draw a diagram to show the variation of binding energy per nucleon with mass numbers for different nuclei and mention its two features. [1+1]
(b) Why do lighter nuclei usually undergo nuclear fusion? [1]
West Bengal WbchseWest Bengal HS (WBCHSE) Board 2024Subjective· 3mImportance★★★★★
90% · 38/42 Questions
You're viewing a preview — the full solution, concept, methods & PYQ mapping are locked.
Start your 14-day free trial to unlock the full solution →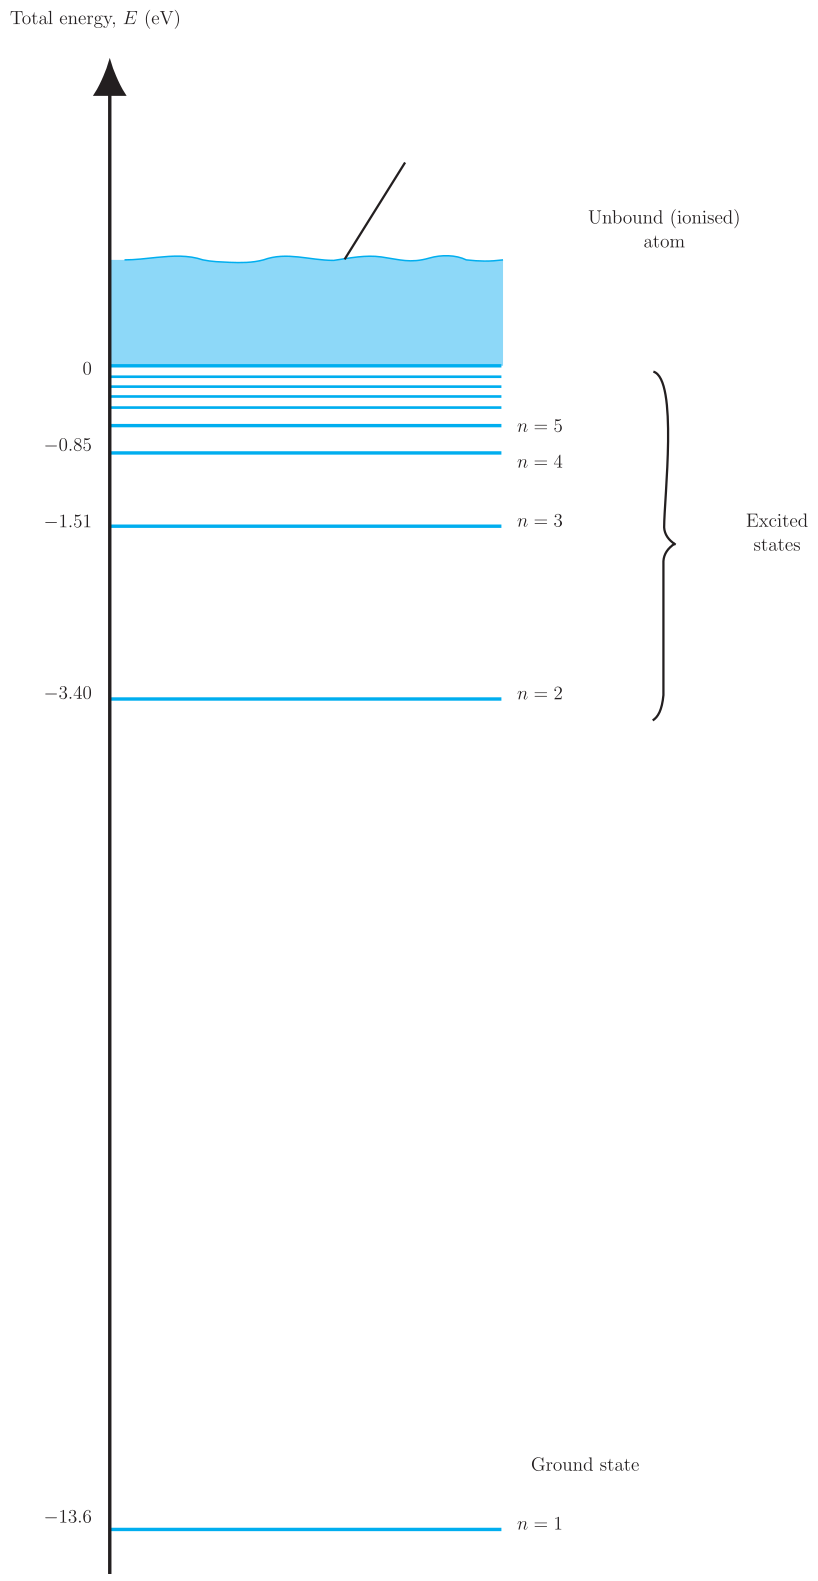
The Rydberg constant follows directly from the ground-state energy via ; the hydrogen energy-level diagram shows all transitions converging on n=1 as the (ultraviolet) Lyman series and on n=2 as the (visible) Balmer series.
- Rydberg constant from ground-state energy: The energy of the electron in the -th Bohr orbit of hydrogen is so for the ground state (): , i.e. . Given eV J J (magnitude). J·m This matches the accepted value (small difference due to rounding of the input constants).
- Hydrogen energy-level diagram: Draw a set of horizontal lines at increasing (less negative) heights representing energy levels (lowest, most negative, eV) up through ( eV), ( eV), ( eV), ..., up to (, the ionisation limit) at the top. …
Unlock everything free for 14 days
- Full step-by-step solutions
- Concept-first explanations
- Methods, shortcuts & mistakes
- PYQ mapping + timed mock tests
Full access for 14 days. No credit card required.