Geography · Ch 15 — Atmospheric Circulation and Weather Systems
Pressure and Wind
Pressure and Wind
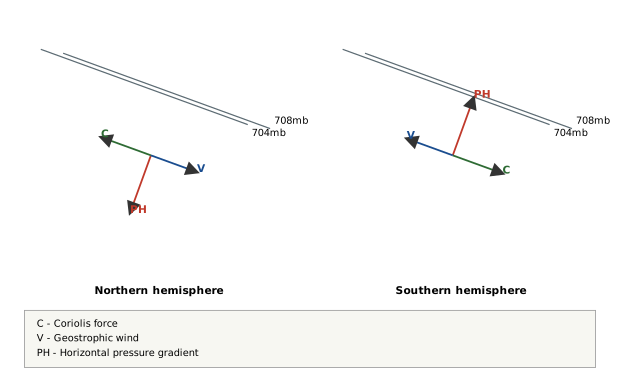
The diagram is built as two side-by-side panels, one labelled for the Northern Hemisphere and one for the Southern Hemisphere. Each panel shows a small patch of the upper atmosphere, roughly 2–3 km above the ground, where surface friction no longer matters. Two straight, parallel isobars run across each panel, carrying the values 704 mb and 708 mb. Because the isobars are straight and evenly spaced, the pressure gradient is uniform in both magnitude and direction across the region.
Three vectors appear in each panel. One vector, labelled PH (horizontal pressure gradient), points perpendicular to the isobars, from the higher pressure (708 mb) toward the lower pressure (704 mb). A second vector, labelled C (Coriolis force), points in the opposite sense — perpendicular to the isobars but directed from low pressure toward high pressure. The third vector, labelled V (geostrophic wind), lies parallel to the isobars, running between the two perpendicular forces. A small legend at the side defines the three labels: C = Coriolis force, V = Geostrophic wind, PH = Horizontal pressure gradient.
The two panels are mirror images. In the Northern Hemisphere, the pressure gradient points one way across the isobars, the Coriolis force points the opposite way, and the resulting wind blows along the isobars in one direction. In the Southern Hemisphere, the same three vectors appear but flipped left-to-right, so the geostrophic wind runs along the isobars in the opposite direction. This mirror symmetry is the whole point of the figure: the balance of forces is identical in both hemispheres, but the Coriolis deflection acts to the right of motion in the north and to the left in the south, reversing the wind direction.
What the diagram teaches is the meaning of geostrophic balance. When the isobars are straight and friction is absent, the pressure gradient force tries to push air straight across the isobars from high to low pressure. As soon as the air starts moving, the Coriolis force deflects it — to the right in the Northern Hemisphere, to the left in the Southern Hemisphere. The air keeps curving until the Coriolis force exactly opposes the pressure gradient force. At that point the two forces cancel, and the air no longer accelerates; it moves steadily along a straight path parallel to the isobars. That steady, frictionless flow is the geostrophic wind. …
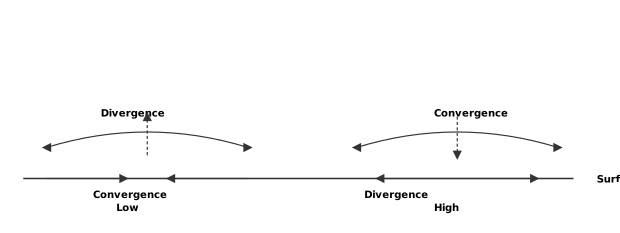
The diagram is built as two side-by-side cross-sections, each showing a vertical slice of the atmosphere above a horizontal line labelled Surface. The left panel is the story of a low-pressure system. Arrows enter from both the left and the right at the surface, pointing inward toward a central point — this is the Convergence Low. Once the air meets, the arrows turn upward, rising through the column. At the top of the panel, the arrows split and point outward in opposite directions, labelled Divergence. So the left half reads: converge at the bottom, rise, diverge at the top.
The right panel is the mirror image, the story of a high-pressure system. At the top, arrows come together from both sides, labelled Convergence. The air then descends straight down through the column. At the surface, the arrows split and move outward in opposite directions, labelled Divergence High. So the right half reads: converge at the top, sink, diverge at the bottom. The Surface line runs beneath both panels, anchoring the whole picture to the ground.
What the diagram teaches is the vertical coupling of wind systems. A surface low is not an isolated patch of air — it is the bottom end of a rising column. Air piles in at the ground, is forced upward, and must spill out aloft. That outflow at the top is the divergence that balances the inflow below. A surface high works in reverse: air converges high up, sinks, and spreads outward at the ground. The two panels are not separate phenomena but two halves of the same circulation logic — what goes up must come down, and what comes down must go up. …
| Pressure System | Pressure Condition at the Centre | Northern Hemisphere | Southern Hemisphere |
|---|---|---|---|
| Cyclone | Low | Anticlockwise | Clockwise |
The wind you feel at the surface is the net result of several forces acting together. Its velocity and direction depend on which forces dominate. In the upper atmosphere, roughly 2 to 3 km above the ground, the air is free from the frictional drag of the Earth's surface. There, only two forces matter: the pressure gradient force and the Coriolis force.
When the isobars are straight and friction is absent, these two forces balance each other exactly. The pressure gradient force pushes air from high to low pressure, while the Coriolis force deflects it sideways. Once balanced, the air no longer accelerates across the isobars; instead, it flows parallel to them. This wind is called the geostrophic wind. It is a theoretical ideal, but it closely describes real winds high above the surface.
The pattern of wind circulation around pressure systems follows a clear rule. Around a low-pressure centre, the circulation is called cyclonic circulation; around a high-pressure centre, it is called anticyclonic circulation. The direction of this rotation flips depending on the hemisphere, as summarised below.
| Pressure System | Pressure Condition | Wind Direction at Centre (Northern Hemisphere) | Wind Direction at Centre (Southern Hemisphere) |
|---|---|---|---|
| Cyclone | Low | Anticlockwise | Clockwise |
| Anticyclone | High | Clockwise | Anticlockwise |
The winds in the upper atmosphere, 2-3 km above the surface, are free from the frictional effect of the surface and are controlled mainly by the pressure gradient and the Coriolis force. When isobars are straight and when there is no friction, the pressure gradient force is balanced by the Coriolis force and the resultant wind blows parallel to the isobar -- this wind is known as the geostrophic wind.
The wind circulation around a low is called cyclonic circulation. Around a high it is called anti cyclonic circulation. The direction of winds around such systems changes according to their location in different hemispheres (Table 9.2). …