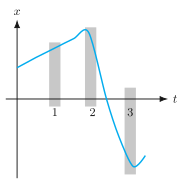
Q.Figure 2.14 gives the x-t plot of a particle in one-dimensional motion. Three different equal intervals of time are shown. In which interval is the average speed greatest, and in which is it the least? Give the sign of average velocity for each interval.
Imagine you're walking home from school. You take a shortcut through a park, then stop to buy a snack, then realise you forgot something and run back a bit, then finally walk home. By the time you reach your front door, you've walked a total of 2 km — but your house is only 500 metres from school in a straight line.
That difference — between the total ground you covered and how far you actually ended up from where you started — is the entire point of speed vs velocity.
The Precise Definitions
Average speed is a measure of how fast something is moving overall. It cares only about the total distance travelled, not the direction.
Average speed=Total time takenTotal distance travelled
Average velocity is a measure of how fast and in what direction something is moving overall. It cares about the net displacement — the straight-line distance from start to finish, with a direction.
Average velocity=Total time takenDisplacement
Note
Displacement is the straight-line distance from the starting point to the ending point, with a direction. Distance is the total length of the actual path travelled, with no direction.
The Key Difference in One Sentence
Speed is a scalar (just a number, like 5 km/h). Velocity is a vector (a number and a direction, like 5 km/h north).
That one word — direction — changes everything.
A Concrete Example
You walk 3 km east, then 4 km north. The whole trip takes 1 hour.
Total distance travelled = 3 + 4 = 7 km
Displacement = straight line from start to finish = 32+42=5 km, northeast
Now compute:
Average speed=1 h7 km=7 km/h
Average velocity=1 h5 km, northeast=5 km/h, northeast
Watch out
A common mistake: students think average velocity is just "speed with direction". It's not. It's displacement divided by time, not distance divided by time. If you walk in a circle and return to your starting point, your displacement is zero — so your average velocity is zero, even though your average speed is positive.
When Are They Equal?
Only when the motion is in a straight line without changing direction. If you walk 2 km east in a straight line, then distance = displacement, so average speed = magnitude of average velocity.
But the moment you turn, or stop, or go backwards — they diverge.
Why This Matters for Exams
In Indian board exams (CBSE, ICSE, state boards), you will be asked to:
Distinguish between speed and velocity (scalar vs vector)
Calculate average speed and average velocity from given data …
Average speed follows the steepness of the x-t curve: steepest in the sharp fall (interval 3), flattest near the peak (interval 2). Average velocity is positive while x rises and negative while it falls.
Interval 3 is the steepest, so the average speed is greatest there; interval 2 is nearly flat near the maximum, so the average speed is least there. The particle moves toward +x in intervals 1 and 2 (positive average velocity) and toward −x in interval 3 (negat …
On an x-t graph the magnitude of the slope is the average speed and its sign is the sign of the average velocity. Interval 3 (the steep fall) has the largest slope magnitude, so the greatest average speed; interval 2 (near the flat maximum) has the smallest slope magnitude, so the least average speed. The velocity is positive where x increases (intervals 1 and 2) and negative where x decreases (interval 3).
Concept
Over an interval,
average velocity=ΔtΔx,average speed=Δtpath length.
For motion along a line without reversal within an interval, the average speed equals the magnitude of the average velocity, i.e. the magnitude of the chord's slope on the x-t graph. The three intervals are equal in duration (Δt the same), so comparing average speeds just means comparing how much x changes.
Comparing the intervals
Interval 1 (gentle rise):x increases by a moderate amount, so a moderate positive slope. Average velocity >0. …
Concept: Cross-Checking a Graph-Reading with an Explicit Numeric Model
Method: Build One Concrete, Consistent x(t) and Compute the Three Average Velocities Directly
Comparing chord slopes "by eye" is the natural first pass, but it can be checked rigorously by constructing one explicit set of numbers consistent with the described shape (positive, rising gently to a rounded max, then falling steeply through zero) and simply computing each average velocity from the definition — the numbers below are only one example, but any numeric assignment matching the qualitative shape must give the same ranking, because that ranking follows from the shape, not the specific values chosen.
Steps
Assign consistent values at four equally spaced instants, matching "gentle rise, rounded near-flat maximum, then a steep fall through zero":
t
0
2
4
6
x
0
8
9
−3
(Interval 1 =[0,2]: gentle rise. Interval 2 =[2,4]: near the rounded max, x barely changes. Interval 3 =[4,6]: steep fall, crossing x=0.)
Compute the average velocity in each interval directly from vˉ=Δx/Δt:
vˉ1=28−0=+4,vˉ2=29−8=+0.5,vˉ3=2−3−9=−6(units: same as x/t)
Compare magnitudes (average speed):∣vˉ2∣=0.5 is the smallest, ∣vˉ3∣=6 is the largest. This matches the qualitative reading: near the rounded top the curve is nearly flat (small Δx over the interval), while the steep fall through zero produces the largest change in x over an equal time.
Read the signs directly from the same table:vˉ1>0, vˉ2>0 (both are rises, even though interval 2's rise is tiny), vˉ3<0 (a fall).
Same / Similar Concept — real previous-year questions on the same or a closely similar concept, not this exact question.
CBSE 2025Set ANNUAL1 markMCQ
Q.A cyclist moving on a circular track of radius 40 m completes half a revolution in 40 s. Its average velocity is
(a) zero
(b) 2 m s^-1
(c) 4 pi m s^-1
(d) 8 pi m s^-1
›Reveal solutionSolution
Average velocity uses DISPLACEMENT, not distance travelled; half a revolution displaces the cyclist by one diameter (2r), giving 2 m/s.
Radius r = 40 m, so diameter = 2r = 80 m.
In half a revolution, the cyclist moves from one end of a diameter to the exact opposite end of the circle. The straight-line displacement between these two points equals the diameter, 80 m (NOT the arc length, which is used for average SPEED, not average velocity).
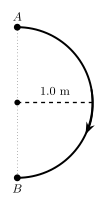
Q.In 1.0 second, a particle goes from point A to point B moving in a semi-circle of radius 1.0m as shown in fig. The magnitude of average velocity is
(a) 3.14 m/s
(b) 2.0 m/s
(c) 1.0 m/s
(d) Zero
›Reveal solutionSolution
Average velocity uses displacement (straight-line distance A to B = diameter), giving 2.0 m/s, not the arc length (which would give average SPEED = 3.14 m/s).
The particle moves along a semicircular arc of radius r = 1.0 m from A to B in time t = 1.0 s.
Displacement (straight line from A to B) = diameter = 2r = 2 x 1.0 = 2.0 m.
Average velocity = displacement / time = 2.0 m / 1.0 s = 2.0 m/s.