Biology · Ch 12 — Ecosystem
Ecological Pyramids
Ecological Pyramids
Ecological Pyramids
The relationship between organisms at different trophic levels — whether expressed in terms of number, biomass, or energy — takes the shape of a pyramid. The base is broad and represents the producers (first trophic level), while the apex is narrow and represents the top-level consumer (tertiary or top carnivore). This shape arises because, at each successive trophic level, the quantity being measured generally decreases.
Three types of ecological pyramids are studied: pyramid of number, pyramid of biomass, and pyramid of energy.
Pyramid of Number
This pyramid shows the number of individual organisms at each trophic level. In a grassland ecosystem, for example, the number of producers (plants) is huge — nearly 6 million plants may support only three top carnivores. The pyramid is upright: producers are most numerous, herbivores fewer, and carnivores fewest.
However, exceptions exist. If you count the number of insects feeding on a single large tree, the tree (one producer) supports many insects (primary consumers), which in turn support a smaller number of birds (secondary consumers), and so on. In such a case, the pyramid of number is inverted — the base is narrow and the apex is broad.
Pyramid of Biomass
This pyramid represents the total mass (biomass) of living organisms at each trophic level at a given time. Biomass is usually measured as dry weight per unit area, which is more accurate than fresh weight because water content varies widely.
In most terrestrial ecosystems, the pyramid of biomass is upright: the biomass of producers is greater than that of herbivores, and herbivore biomass exceeds that of carnivores.
But in the sea, the pyramid of biomass is generally inverted. The biomass of fishes far exceeds that of phytoplankton (the producers). This seems paradoxical — how can a small standing crop of phytoplankton support a much larger biomass of consumers? The explanation lies in the high turnover rate of phytoplankton: they reproduce and grow very quickly, so even a small standing crop can sustain a large consumer biomass over time.
Pyramid of Energy
The pyramid of energy is always upright and can never be inverted. This is because when energy flows from one trophic level to the next, some energy is always lost as heat at each step — a consequence of the second law of thermodynamics. Each bar in the energy pyramid indicates the amount of energy present at that trophic level in a given time (or annually per unit area).
An ideal pyramid of energy shows that primary producers convert only about 1% of the sunlight energy available to them into net primary productivity (NPP). The energy decreases sharply at each higher trophic level.
Important Points to Remember
- Any calculation of energy content, biomass, or numbers must include all organisms at that trophic level. Taking only a few individuals leads to incorrect generalisations.
- A given organism may occupy more than one trophic level simultaneously. For example, a sparrow is a primary consumer when it eats seeds and fruits, but a secondary consumer when it eats insects and worms. Human beings also function at multiple trophic levels depending on their diet.
- The trophic level represents a functional level, not a species as such. A species can occupy different trophic levels in the same ecosystem at the same time.
- In most ecosystems, all three pyramids — of number, biomass, and energy — are upright. Exceptions occur mainly in pyramids of number (e.g., tree-insect-bird) and pyramids of biomass (e.g., marine ecosystems). The pyramid of energy is always upright.
Summary Table of Pyramid Types
| Pyramid Type | What It Measures | Typical Shape | Exceptions |
|---|---|---|---|
| Number | Number of individuals at each trophic level | Upright | Inverted when one producer supports many consumers (e.g., a tree) |
| Biomass | Mass of living material (dry weight) at each trophic level | Upright | Inverted in oceans (fish biomass > phytoplankton biomass) |
| Energy | Amount of energy present at each trophic level | Always upright | None — energy always decreases due to heat loss |
Limitations of Ecological Pyramids
Ecological pyramids are a useful simplification, but the textbook is explicit that they have real limitations: …
Drawn by us to help you understand the concept clearly, and verified to make sure it's accurate. For exams, practice from your textbook's own diagram.
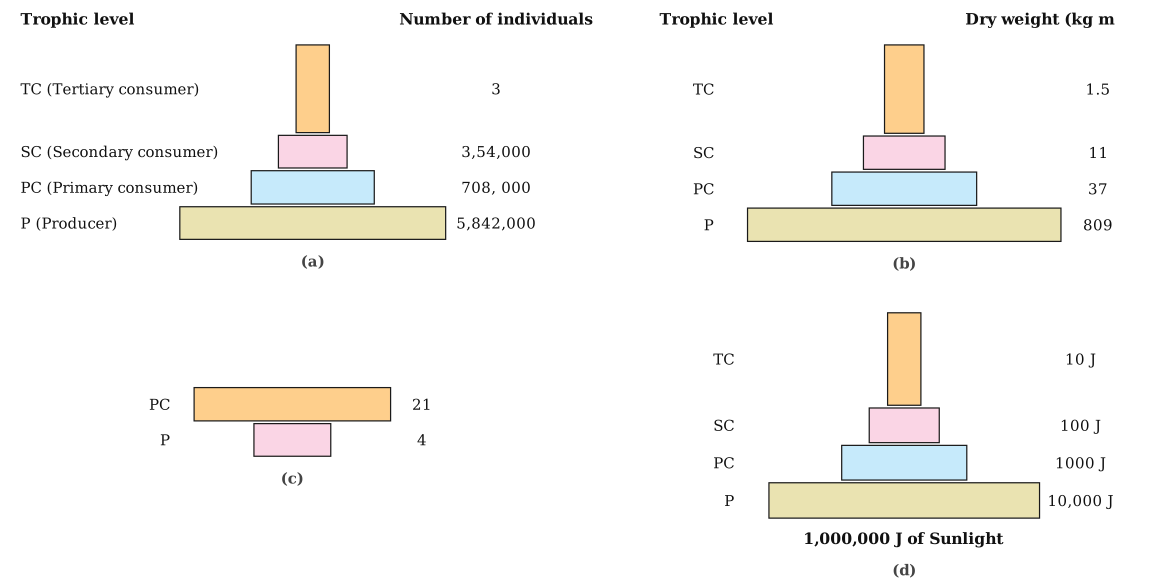
This figure compares four kinds of ecological pyramid:
- Pyramid of numbers (grassland) — upright, narrowing sharply from producers up to top carnivores: P = 58,42,000 → PC = 7,08,000 → SC = 3,54,000 → TC = 3 individuals. Nearly 6 million plants ultimately support only 3 top carnivores.
- Pyramid of biomass (terrestrial) — also upright, decreasing sharply at each higher level: P = 809 → PC = 37 → SC = 11 → TC = 1.5 kg/m² (dry weight).
- Inverted pyramid of biomass (aquatic) — the real figure shows only two levels here, not four: a small standing crop of phytoplankton (P ≈ 4 g/m²) supports a much larger standing crop of zooplankton (PC ≈ 21 g/m²) that feeds on it. The pyramid is inverted because the producers are replaced so fast that a small standing crop can still support a larger biomass of consumers at any given moment.
- Pyramid of energy — an ideal energy pyramid, always upright for every ecosystem because energy is lost as heat at each transfer and can never flow backward up the pyramid. The real figure prints actual energy values at each step: 1,000,000 J of sunlight -> P = 10,000 J -> PC = 1,000 J -> SC = 100 J -> TC = 10 J — each level retaining only about 10% of the level below it. …