Biology · Ch 12 — Ecosystem
Energy Flow
Energy Flow
The flow of energy is the single most important process that makes an ecosystem work. Every living organism needs energy to survive, grow, and reproduce, and that energy ultimately comes from one source: the sun. But energy does not cycle like matter — it moves in one direction, entering the system, passing from one organism to another, and eventually leaving as heat.
This one-way movement of energy is called energy flow. It is the foundation of every food chain and food web.
The ultimate source: sunlight
All ecosystems are powered by solar radiation. Plants, algae, and some bacteria capture this light energy through photosynthesis and convert it into chemical energy stored in organic compounds (like glucose). These organisms are called producers or autotrophs.
Only a tiny fraction of the sunlight that reaches the Earth actually gets used by producers. Most of it is reflected back or absorbed and converted to heat. The energy that is fixed by producers is called gross primary productivity (GPP). After the producers use some of this energy for their own respiration (to stay alive and grow), the remaining energy is net primary productivity (NPP). This NPP is the energy actually available to the next trophic level — the herbivores that eat the producers.
The direction of flow: one-way and irreversible
Energy moves through an ecosystem in a single direction. It enters as sunlight, is converted to chemical energy by producers, then passes to consumers (herbivores, then carnivores), and finally to decomposers. At every step, a large amount of energy is lost as heat due to respiration and other metabolic activities. This heat cannot be reused by the ecosystem to do work — it is dissipated into the environment.
This is why energy flow is described as unidirectional and non-cyclic. Unlike nutrients (like carbon or nitrogen), which are recycled again and again, energy must be constantly supplied by the sun. If the sun stopped shining, the entire energy flow would stop, and the ecosystem would collapse.
Trophic levels and the 10 per cent law
Organisms are grouped into trophic levels based on how they obtain food:
- First trophic level: Producers (plants)
- Second trophic level: Primary consumers (herbivores)
- Third trophic level: Secondary consumers (small carnivores that eat herbivores)
- Fourth trophic level: Tertiary consumers (top carnivores that eat other carnivores)
As energy moves from one trophic level to the next, most of it is lost. Only about 10 per cent of the energy available at one level is transferred to the next level. This is known as the 10 per cent law, proposed by Lindeman.
For example, if producers capture 10,000 joules of energy from the sun, only about 1,000 joules will be available to herbivores, and only about 100 joules to the next level of consumers. The rest is used for respiration, lost as heat, or remains unconsumed.
The 10 per cent law explains why food chains rarely have more than four or five trophic levels. By the time energy reaches the top, there is simply too little left to support another level of large organisms.
Food chains and food webs
A food chain is a linear sequence showing who eats whom — for example: grass → grasshopper → frog → snake → hawk. Each arrow represents the transfer of energy from one organism to another.
In nature, however, most organisms eat more than one type of food and are eaten by more than one predator. This creates a complex, interconnected network called a food web. A food web gives a more realistic picture of energy flow in an ecosystem than a simple food chain.
There are two main types of food chains:
- Grazing food chain: Starts with living plants (producers) and goes to herbivores and then carnivores. This is the chain most people think of.
- Detritus food chain: Starts with dead organic matter (detritus) — fallen leaves, dead animals, etc. — and is fed upon by decomposers (like bacteria and fungi) and detritivores (like earthworms). This chain is often more important in terms of total energy flow in many ecosystems, especially forests.
Toward ecological pyramids
This decrease of energy (and, generally, of numbers and biomass) at each successive trophic level can be shown graphically as an ecological pyramid — covered in full in the next section (12.5).
Decomposers and the detritus pathway …
Drawn by us to help you understand the concept clearly, and verified to make sure it's accurate. For exams, practice from your textbook's own diagram.
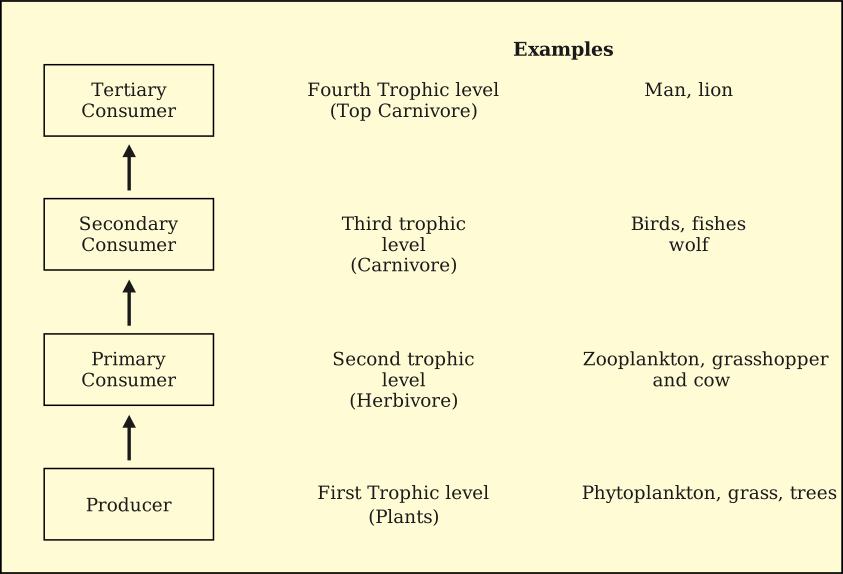
The figure is a bottom-up flowchart, not a table: four stacked boxes (Producer at the bottom, then Primary Consumer, Secondary Consumer, and Tertiary Consumer at the top) are linked by upward-pointing arrows, one box directly above the next — the real figure does not include a sun icon. To the right of the boxes run two text columns: the trophic-level name/type, and worked Examples:
- Producer — First Trophic level (Plants) — e.g. phytoplankton, grass, trees
- Primary Consumer — Second trophic level (Herbivore) — e.g. zooplankton, grasshopper and cow
- Secondary Consumer — Third trophic level (Carnivore) — e.g. birds, fishes, wolf
- Tertiary Consumer — Fourth Trophic level (Top Carnivore) — e.g. man, lion …
Drawn by us to help you understand the concept clearly, and verified to make sure it's accurate. For exams, practice from your textbook's own diagram.
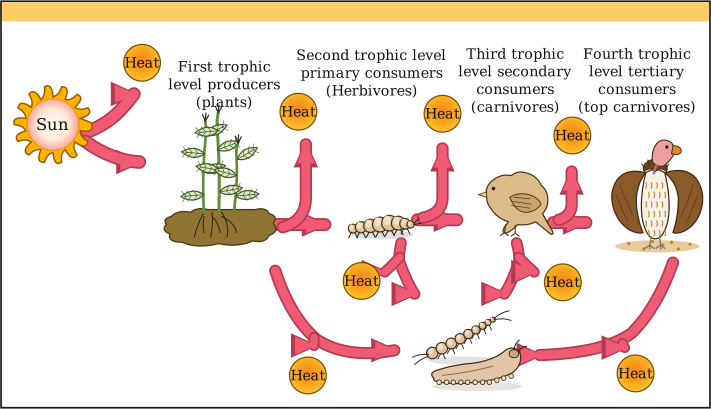
The figure is a pictorial energy-flow diagram, not an abstract box-and-arrow flowchart — it is drawn with illustrated organism icons, not labelled rectangles. Left to right: a Sun icon, then an illustrated seedling/plant icon labelled "First trophic level producers (plants)", a caterpillar icon labelled "Second trophic level primary consumers (Herbivores)", a small bird icon labelled "Third trophic level secondary consumers (carnivores)", and a pair of vulture icons labelled "Fourth trophic level tertiary consumers (top carnivores)".
At every transfer the arrow forks: part of the energy continues on to the next organism, and part is diverted into a small circular orange "Heat" bubble — this happens four separate times (Sun to producers, producers to herbivores, herbivores to secondary consumers, secondary to tertiary consumers), so the diagram shows several distinct Heat bubbles across the top, not one single downward arrow per box. Below the main row, a second tier of arrows carries this lost energy further down, converging on detritivore/decomposer icons (insect/worm-like figures, drawn at the bottom-centre of the frame) — every trophic level's losses ultimately reach the decomposers, shown by arrows funnelling in from both sides, not a single vertical "Decomposers" arrow. …

Drawn by us to help you understand the concept clearly, and verified to make sure it's accurate. For exams, practice from your textbook's own diagram.
The figure shows the textbook's own in-text example of a grazing food chain (GFC) — the chain that starts from living plants:
Grass (Producer) → Goat (Primary Consumer) → Man (Secondary consumer)
Each organism is linked to the next by a dashed arrow pointing toward the eater, with a trailing arrow after Man indicating the chain continues (energy keeps moving onward — ultimately to decomposers and heat). The printed chain is text-and-arrows only; the roles in parentheses are part of the figure itself. …