Chemistry · Ch 6 — Chemical Kinetics
Graphical representation of the first order reactions
Graphical representation of the first order reactions
i. The differential rate law for the first order reaction is
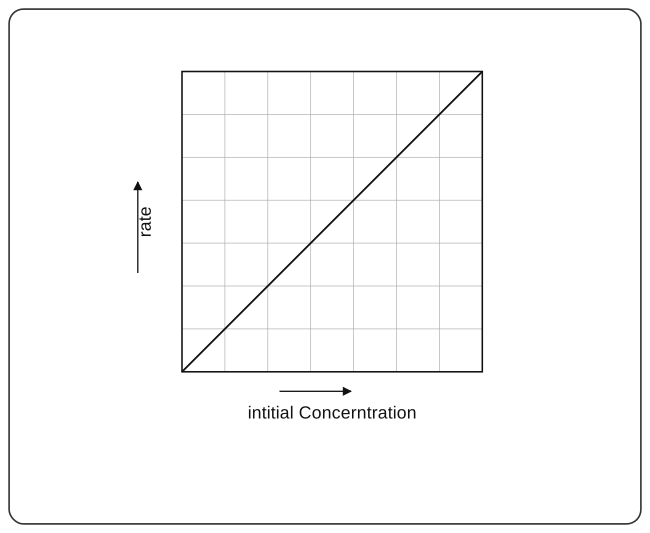
The book marks the terms of this equation with small arrows mapping it onto the straight-line form : the rate is , is the slope , is and the added zero is the intercept . A plot of rate versus concentration is therefore a straight line passing through the origin, as shown in Fig. 6.3. The slope of the straight line .
Drawn by us to help you understand the concept clearly, and verified to make sure it's accurate. For exams, practice from your textbook's own diagram.
What this figure shows. For a first order reaction the differential rate law rate is a straight line through the origin when rate is plotted against concentration: doubling [A] doubles the rate, and the slope of the line is . *(The book's printed x-axis label reads "intitial Concerntration" — its own double mispr …
ii. From Eq. (6.7) the integrated rate law is
On rearrangement, the equation becomes
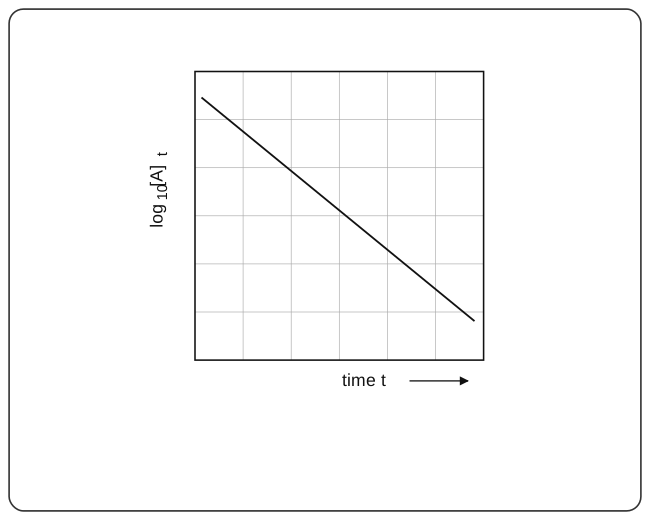
This too maps term by term onto the straight-line equation: is , is the slope , is and is the intercept . A graph of versus yields a straight line with slope and y-axis intercept , as shown in Fig. 6.4.
Drawn by us to help you understand the concept clearly, and verified to make sure it's accurate. For exams, practice from your textbook's own diagram.
What this figure shows. Plotting against time t turns the first order integrated rate law into a straight line: . The line falls with slope and cuts the y-axis at — measuring th …
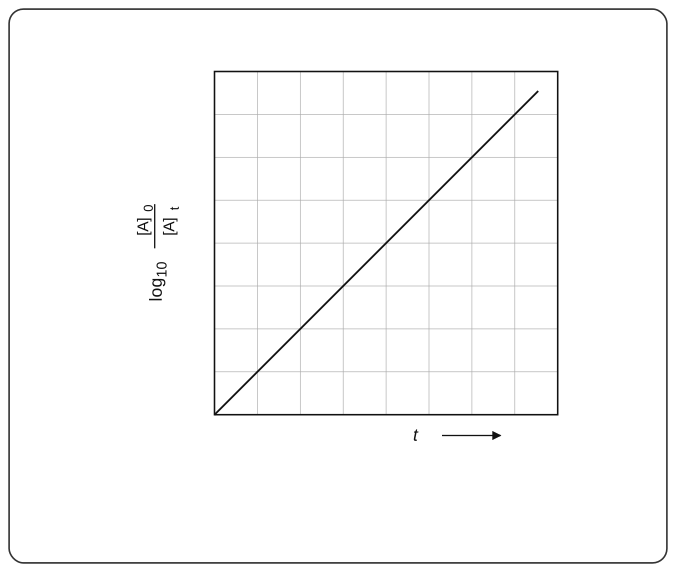
iii. Eq. (6.7) gives …
Drawn by us to help you understand the concept clearly, and verified to make sure it's accurate. For exams, practice from your textbook's own diagram.
What this figure shows. The same integrated rate law rearranged as has no intercept term — so the plot of versus t is a straight line **passing t …