Chemistry · Ch 2 — Solutions
Freezing Point Depression as a Consequence of Vapour Pressure Lowering
Freezing Point Depression as a Consequence of Vapour Pressure Lowering
The effect of dissolution of a nonvolatile solute on the freezing point of a solvent can be understood in terms of the vapour pressure lowering.
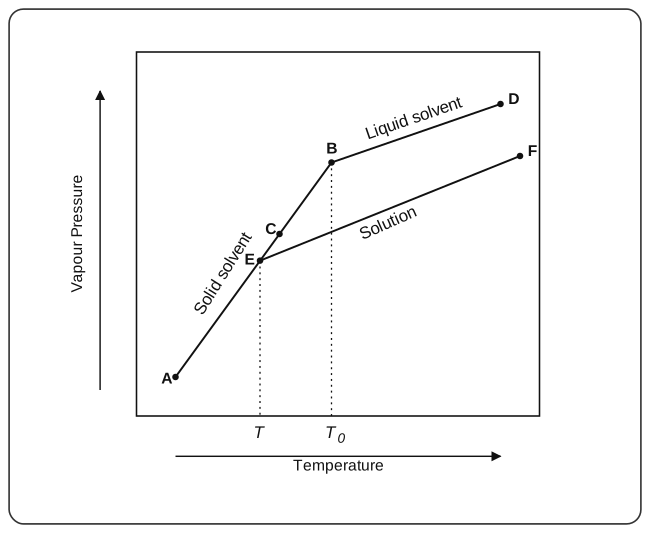
Consider the vapour pressure-temperature diagram shown in Fig. 2.7. The diagram consists of three curves: AB is the vapour pressure curve of the solid solvent, while CD is the vapour pressure curve of the pure liquid solvent. EF is the vapour pressure curve of the solution, and it always lies below that of the pure solvent. It is important to note that the solute does not dissolve in the solid solvent.
Drawn by us to help you understand the concept clearly, and verified to make sure it's accurate. For exams, practice from your textbook's own diagram.
What this figure shows. Vapour pressure (y-axis) against temperature (x-axis) with three labelled lines: the steep Solid solvent line rising from A through E and C to B; the Liquid solvent line continuing up-right from B to D; and the Solution line from E to F, lying below the liquid-solvent line. Dotted verticals are dropped from E and from B to the temperature axis, whose ticks the book prints as (the freezing point of the solution, i.e. ) and (the freezing point of the pure solv …
The curves AB and CD intersect at point B, where solid and liquid phases of the pure solvent are in equilibrium: the two phases have the same vapour pressure at B. The temperature corresponding to B is the freezing point of the pure solvent, .
Similarly, at E -- the point of intersection of EF and AB -- the solid solvent and the solution are in equilibrium; they have the same vapour pressure at E. The temperature corresponding to E is the freezing point of the solution, .
It is clear from the figure that the freezing point of the solution, , is lower than that of the pure solvent, . It is obvious, because the vapour pressure curve of the solution lies below that of the solvent. …