Physics · Ch 15 — Structure of Atoms and Nuclei
Atomic Spectra
Atomic Spectra
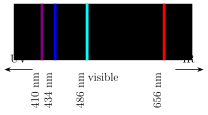
When an ordinary solid object is heated, it glows and emits light across a broad, continuous range of wavelengths -- passing that light through a prism produces a smooth, unbroken rainbow (a continuous spectrum). Hydrogen gas, heated to a high temperature inside a glass discharge tube, behaves completely differently: the light it emits, when passed through a prism, breaks up into a small number of individual, sharply defined bright lines rather than a smooth band -- a line spectrum, with dark gaps in between where no light at all is emitted. In the visible range specifically, hydrogen emits only at four wavelengths: 410 nm, 434 nm, 486 nm and 656 nm, and nothing in between.
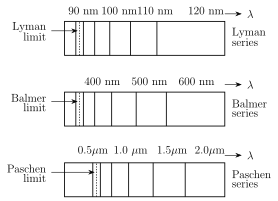
Hydrogen also emits additional lines outside the visible range, in the ultraviolet and infrared. Studying these systematically, scientists found the many lines naturally group into distinct series, each named after the person who first studied it, ordered from shortest to longest characteristic wavelength: the Lyman series (in the ultraviolet), then the Balmer series (the one containing the four visible lines above), then the Paschen, Brackett and Pfund series (extending progressively further into the infrared). Within any one series, successive lines get closer and closer together as their wavelength decreases, crowding in toward a limiting shortest wavelength for that series -- the series limit -- which the lines approach but never quite reach. …
Drawn by us to help you understand the concept clearly, and verified to make sure it's accurate. For exams, practice from your textbook's own diagram.
What this figure shows. A line spectrum diagram for the visible portion of the hydrogen emission spectrum, shown as it would appear after passing the light from a heated hydrogen discharge tube through a prism: rather than a smooth, continuous band of colour, only four bright, sharp emission lines appear against a dark background, at wavelengths of 410 nm, 434 nm, 486 nm and 656 nm (these four visible-range lines are the first four members of what is later named the Balmer series). No other wavelengths appear anywhere between or around these four lines in the visible window -- the figure's entire point is to show the emission is discre …
Drawn by us to help you understand the concept clearly, and verified to make sure it's accurate. For exams, practice from your textbook's own diagram.
What this figure shows. A schematic wavelength axis spanning from the ultraviolet (UV), through the visible band, into the infrared (IR), with three separate groups of converging spectral lines drawn stacked one above another, one group per series: the Lyman series positioned entirely in the UV region, the Balmer series positioned in the visible region, and the Paschen series positioned in the IR region. Within each group, the individual lines are drawn crowding closer and closer together as wavelength decreases, visually converging toward a limiting (shortest) wavelength for that series, which is marked with a vertical dotted line -- the series limit each series approaches but never quite reach …