Applied Mathematics · Ch 7 — Inferential Statistics
One Sample T- Test
One Sample T- Test
The one-sample t-test checks whether a sample mean is genuinely different from a known or claimed population value. You draw a single random sample, compute its mean, and compare that mean against the value you're testing against — deciding, on the strength of the sample alone, whether the population really differs from that benchmark.
The test statistic is:
where is the value being tested against (the "comparison value"), is the sample mean, is the sample standard deviation, and is the sample size. The denominator, , is the standard error of the mean — it scales the gap between and by how much sample means naturally vary from sample to sample. …
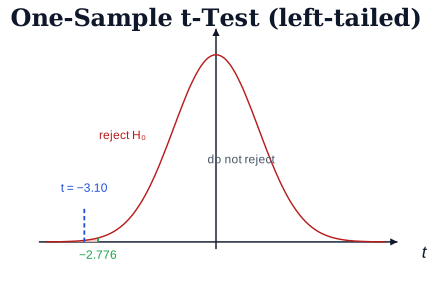
Drawn by us to help you understand the concept clearly, and verified to make sure it's accurate. For exams, practice from your NCERT textbook's own diagram.
The obtained t = −3.10 lies beyond the critical value −2.776, inside the rejection region, s …