Single Slit Diffraction: From Intuition to Precision
Imagine you're standing at the edge of a swimming pool and you send a straight wave toward a narrow gap in a wall. If the gap is wide, the wave mostly goes straight through — a clean "shadow" behind the wall. But if the gap is tiny, something strange happens: the wave spreads out in all directions beyond the gap, like ripples from a pebble. That spreading is diffraction.
Light does the same thing. When a parallel beam of light passes through a single narrow slit, it doesn't just make a sharp rectangle on a screen. Instead, you get a pattern: a bright central band, then dark bands (minima), then weaker bright bands (maxima), alternating as you move outward. The narrower the slit, the more the light spreads.
Why does this happen? The core idea
Light from every point across the slit travels to the screen. At any point on the screen, the light arriving from different parts of the slit has travelled different distances. If those path differences are exactly half a wavelength (λ/2), the waves cancel — you get darkness. If they are a whole wavelength (λ), they reinforce — you get a weaker bright band.
The key is that the slit is not a point source. It's a continuous line of sources, each sending out Huygens wavelets. The pattern is the result of interference among all those wavelets.
Common mistake
Students often think diffraction is just "bending around corners." That's part of it, but the real physics is interference between wavelets from different parts of the same slit. Without that interference, there would be no alternating dark and bright bands — just a fuzzy blur.
The precise condition for minima
Let the slit width be a and the wavelength be λ. For a point on a screen far away (the Fraunhofer or far-field condition), light rays from the slit are nearly parallel. The path difference between a wavelet from the top edge and one from the centre is 2asinθ, where θ is the angle from the straight-through direction.
For the first minimum, the wavelets from the top half of the slit cancel those from the bottom half exactly. That happens when the path difference between the two edges is exactly one wavelength:
asinθ=λ
For the second minimum, the slit can be divided into four equal zones, each cancelling the next, giving:
asinθ=2λ
In general, the condition for dark fringes (minima) is:
asinθ=mλfor m=±1,±2,±3,…
Notice m=0 is not a minimum — it's the centre of the bright central maximum.
What about the maxima?
The maxima occur roughly halfway between minima, but their positions are not given by a simple formula like asinθ=(m+21)λ. That formula works for double-slit interference, but for a single slit the maxima are slightly shifted. The exact positions come from solving a calculus problem (the derivative of the intensity function), but for exams you only need the minima condition and the fact that the central maximum is twice as wide as the others.
Quick exam fact
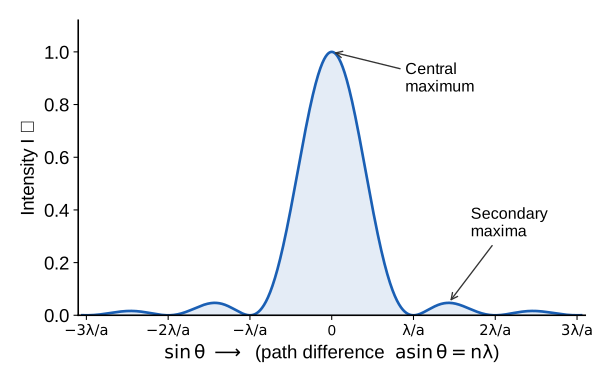
The angular width of the central maximum is 2θ1, where θ1 satisfies asinθ1=λ. So the central maximum spans from −λ/a to +λ/a in sinθ.
The intensity pattern (qualitative) …