What a Limit Really Asks
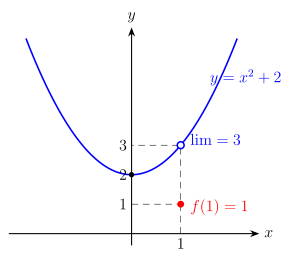
A limit answers one question: as the input x crowds in on some point x0 from both sides, what value does f(x) crowd in on? Crucially, this is a statement about the neighbourhood of x0, not about the point itself. Whether f is even defined at x0 — or what value it takes there if it is — is irrelevant to whether the limit exists.
Definition 9.1 (informal). Let I be an open interval containing x0 and let f:I→R. We say limx→x0f(x)=L if, whenever x is taken sufficiently close to x0 (from either side, with x=x0), f(x) gets correspondingly close to L.
A good mental model: imagine feeding the function a sequence of x-values that homes in on x0 — never landing exactly on x0. If every such approach forces f(x) toward one and the same number L, no matter how you approach, then L is the limit.
A worked illustration. Take f(x)=x2+1 near x=3. Plugging in values like 2.9,2.99,2.999 and 3.1,3.01,3.001 shows f(x) creeping toward 10 from both sides — and indeed f(3)=10 too. Here the limit and the function value agree, which is the friendly case. But that agreement is a bonus, not a requirement of the definition.
One-sided limits
Because "approaching from either side" is doing real work in the definition, it helps to split it into two directions.
- Left-hand limit (Definition 9.2): limx→x0−f(x)=l1 — the value f(x) settles toward as x increases up to x0 while staying less than x0.
- Right-hand limit (Definition 9.3): limx→x0+f(x)=l2 — the value f(x) settles toward as x decreases down to x0 while staying greater than x0.
The reconciliation theorem: the two-sided limit limx→x0f(x) exists and equals L if and only if both one-sided limits exist and agree:
limx→x0−f(x)=L=limx→x0+f(x)
If even one of the one-sided limits fails to exist, or the two one-sided limits disagree, the two-sided limit simply does not exist — there is no "in-between" value to fall back on.
Reading limits from tables and graphs
Before any algebraic machinery, limits can be estimated two ways:
- Table of values — plug in x-values that approach x0 from below and above, and watch what f(x) trends toward.
- Graph — trace the curve with your eye from both sides of x0 and see where the two traces converge (or fail to).
When limits genuinely fail to exist
The classic culprit is a function that behaves differently on the two sides of the point.
Example. Consider g(x)=∣x∣x (undefined at x=0). For x>0, ∣x∣x=1; for x<0, ∣x∣x=−1. So
limx→0−g(x)=−1,limx→0+g(x)=+1.
These disagree, so limx→0g(x) does not exist — even though g is perfectly well-behaved (constant, even) on either side individually. This is the signature pattern of a "jump" in behaviour: two honest, finite one-sided limits that simply don't match.
Similarly, a function like the greatest-integer (floor) function has a limit that fails to exist at every integer, for exactly this reason: approaching an integer n from below gives n−1, from above gives n. …