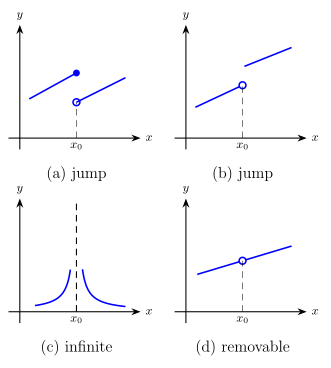
Q.State how continuity is destroyed at for each of the following graphs (Fig. 9.38-9.41). (a) A curve drawn for ends at a solid (filled) point directly above ; a second branch starts at an open circle a little lower (directly below that solid point) and continues for . (b) A curve drawn for approaches an open circle above from the left; a separate branch (of the same underlying curve) resumes just to the right of , a little higher up, with no point plotted at itself. (c) A curve has a vertical asymptote at (dashed line): it plunges to as and rises up from as . (d) A curve drawn for approaches an open circle above ; a second branch starts at a solid point a little lower (directly below that open circle) and continues upward for .
You're viewing a preview — the full solution, concept, methods & PYQ mapping are locked.
Start your 14-day free trial to unlock the full solution →For each figure, identify which of the three continuity conditions — defined, the limit exists, the limit equals — fails, and classify the discontinuity using the standard vocabulary: removable (limit exists, but is either undefined or doesn't match it), jump (both one-sided limits exist but disagree with each other), or infinite (a one-sided limit is unbounded, so no finite limit exists at all).
Step 1. Fig 9.38 — graph (a). The curve approaches, from the left, a solid filled point directly above — so the left-hand limit exists and equals the height of that solid dot, call it . The function's actual value , however, is plotted lower, at an open circle at itself, from which the right branch continues. So the (two-sided) limit exists and equals , but (it sits at the lower, differently-plotted height). Since the limit exists but disagrees with the function's actual value at the point, this is a removable discontinuity — redefining to equal would restore continuity.
Step 2. Fig 9.39 — graph (b). The curve is a single smooth unbroken shape on both sides of , with only ONE point missing: an open circle sits where the curve would naturally pass directly above , but there is no solid dot plotted anywhere at . So both the left-hand and right-hand limits exist and agree (it's visibly the same continuous curve on both sides), meaning exists — but itself is simply undefined (no value assigned at ). Since the limit exists but fails to be defined at all, this is also a removable discontinuity — defining to equal that limit would restore continuity.
Step 3. Fig 9.40 — graph (c). The curve has a vertical asymptote at (shown as a dashed vertical line): it plunges toward as and rises up from as . Neither one-sided limit is a finite number — both are unbounded — so does not exist in any finite sense. This is an infinite discontinuity: it can never be "fixed" by redefining a single point, since the function is unbounded near . …
Unlock everything free for 14 days
- Full step-by-step solutions
- Concept-first explanations
- Methods, shortcuts & mistakes
- PYQ mapping + timed mock tests
Full access for 14 days. No credit card required.