Question 126 of 126
Q.Draw one PV diagram each for
(i) isothermal process,
(ii) isobaric process and
(iii) isochoric process.
Tamil Nadu DgeTamil Nadu HSC First Year (DGE) Board 2026Subjective· 3mImportance★★★★★
100% · 126/126 Questions
You're viewing a preview — the full solution, concept, methods & PYQ mapping are locked.
Start your 14-day free trial to unlock the full solution →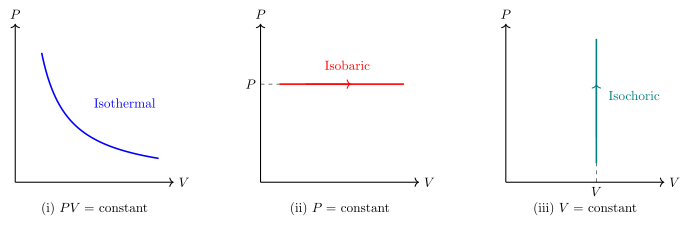
On a P-V diagram, an isothermal process traces a hyperbola (PV = constant), an isobaric process traces a horizontal line (constant P), and an isochoric process traces a vertical line (constant V).
A PV (pressure-volume) diagram plots pressure P on the vertical axis against volume V on the horizontal axis, and the shape of the curve for a thermodynamic process shows how P and V vary together during that process.
- Isothermal process (constant temperature): Since T is constant, PV = mu*RT = constant, so P = constant/V. This is a rectangular hyperbola — as V increases, P decreases smoothly, and the curve never touches either axis. On the PV diagram, this appears as a smooth downward-curving line from the upper-left (high P, low V) to the lower-right (low P, high V).
- Isobaric process (constant pressure): Since P is held fixed while V changes (e.g., a gas expanding at constant pressure as it's heated), the graph is a horizontal straight line at the height P = constant, with V increasing (or decreasing) along that line. …
Unlock everything free for 14 days
- Full step-by-step solutions
- Concept-first explanations
- Methods, shortcuts & mistakes
- PYQ mapping + timed mock tests
Full access for 14 days. No credit card required.