Business Mathematics and Basic Statistics · Ch 9 — Sets — Operations and Functions
Venn Diagrams — Picturing Set Operations
Venn Diagrams — Picturing Set Operations
A Venn diagram represents sets as overlapping regions, usually drawn as circles (or ovals) inside a rectangle representing the universal set . Every set operation from the last two sections has a direct, visual counterpart in a Venn diagram — this is exactly why Venn diagrams are the standard tool for verifying set-operation properties without needing an algebraic proof, which is precisely how this syllabus uses them.
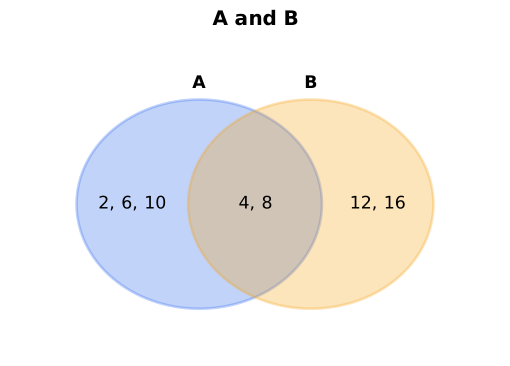
The figure above places every element of and (the same pair used in Section 3) into its correct region: inside only; inside only; and inside the overlapping lens shared by both. Once every element is placed like this, each operation can be read off directly from the same picture: is every element shown; is just the lens, ; and is the part of outside the lens, .
Reading a Venn diagram is a matter of matching the shaded region to its defining condition: shades everywhere that is in or (both circles, no gaps); shades only the lens-shaped overlap (in both at once); shades only the part of that is outside ; and shades everything in the surrounding rectangle that falls outside the circle for . …
A diagram representing sets as overlapping circles (or ovals) inside a rectangle representing the universal set , used to visualise set operations and verify set-identities b …