Economics · Ch 10 — Presentation of Data
Simple Bar Diagram
Simple Bar Diagram
A simple bar diagram shows a single set of values using one bar per category, the height of each bar equal to the value it represents. A category with a longer bar has more of the measured characteristic than one with a shorter bar — for instance a state whose literacy bar is taller has higher literacy than a state whose bar is shorter.
Such diagrams suit both frequency-type and non-frequency-type data, and both discrete variables (family size, spots on a die, examination grades) and attributes (gender, religion, caste, country). They are especially convenient for non-frequency data such as income–expenditure figures or exports and imports over the years. Bars are commonly used for time-series data — for example, foodgrain produced year by year, or literacy rates over successive census years.
Activity …
Drawn by us to help you understand the concept clearly, and verified to make sure it's accurate. For exams, practice from your textbook's own diagram.
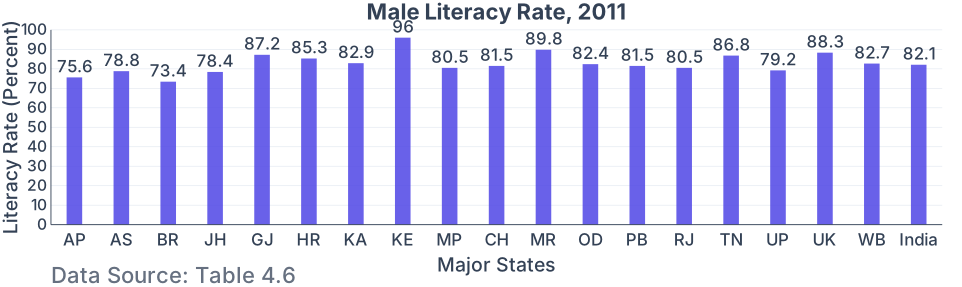
A simple vertical bar diagram. The x-axis lists 19 categories (major states plus the all-India figure); the y-axis is the male literacy rate in per cent, gridded 0–100. Each bar's height (and its top label) gives that state's 2011 male literacy. Reading across, the bars let you compare states at a glance: Kerala is tallest at , Bihar shortest at , and the India bar () is a …
| Major Indian States | 2001 Male | 2001 Female | 2011 Male | 2011 Female |
|---|---|---|---|---|
| Andhra Pradesh (AP) | 70.3 | 50.4 | 75.6 | 59.7 |
| Assam (AS) | 71.3 | 54.6 | 78.8 | 67.3 |
| Bihar (BR) | 59.7 | 33.1 | 73.4 | 53.3 |
| Jharkhand (JH) | 67.3 | 38.9 | 78.4 | 56.2 |
| Gujarat (GJ) | 79.7 | 57.8 | 87.2 | 70.7 |
| Haryana (HR) | 78.5 | 55.7 | 85.3 | 66.8 |
| Karnataka (KA) | 76.1 | 56.9 | 82.9 | 68.1 |
| Kerala (KE) | 94.2 | 87.7 | 96.0 | 92.0 |
| Madhya Pradesh (MP) | 76.1 | 50.3 | 80.5 | 60.0 |
| Chhattisgarh (CH) | 77.4 | 51.9 | 81.5 | 60.6 |
| Maharashtra (MR) | 86.0 | 67.0 | 89.8 | 75.5 |
| Odisha (OD) | 75.3 | 50.5 | 82.4 | 64.4 |
| Punjab (PB) | 75.2 | 63.4 | 81.5 | 71.3 |
| Rajasthan (RJ) | 75.7 | 43.9 | 80.5 | 52.7 |
| Tamil Nadu (TN) | 82.4 | 64.4 | 86.8 | 73.9 |
| Uttar Pradesh (UP) | 68.8 | 42.2 | 79.2 | 59.3 |