Question 31 of 42
Q.Draw a graph between the frequency (ν) and the maximum kinetic energy of the electrons emitted from the surface of a photosensitive material. State clearly how this graph can be used to determine the
(i) Planck's constant and
(ii) Work function of the material.
OR
Draw a graph showing the variation of photoelectric current with collector plate potential for two different frequencies ν1 and ν2, ν2 > ν1 of incident radiation having the same intensity. In which case will the stopping potential be higher? Justify your answer by using Einstein's photoelectric equation.
West Bengal WbchseWest Bengal HS (WBCHSE) Board 2022Subjective· 3mImportance★★★★★
74% · 31/42 Questions
You're viewing a preview — the full solution, concept, methods & PYQ mapping are locked.
Start your 14-day free trial to unlock the full solution →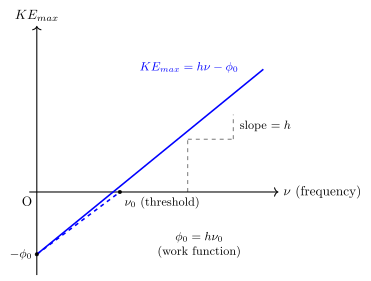
Einstein's photoelectric equation is a straight-line equation in vs ; its slope gives and its intercepts give /.
Einstein's photoelectric equation:
where is the threshold frequency of the metal.
Plotting (y-axis) against (x-axis) gives a straight line of the form , with:
- Slope : measuring the slope of the line directly gives the value of Planck's constant, independent of which metal is used (all metals give parallel lines).
- x-intercept (where ) , the threshold frequency. …
Unlock everything free for 14 days
- Full step-by-step solutions
- Concept-first explanations
- Methods, shortcuts & mistakes
- PYQ mapping + timed mock tests
Full access for 14 days. No credit card required.