Q.How can you calculate the value of Planck's constant from the graph of stopping potential and wavelength of incident wave?
You're viewing a preview — the full solution, concept, methods & PYQ mapping are locked.
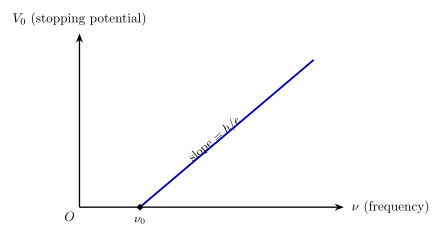
Start your 14-day free trial to unlock the full solution →Since eV0 = hnu - W0, a graph of stopping potential V0 versus frequency nu is a straight line whose slope equals h/e; multiplying the measured slope by the electronic charge e gives Planck's constant.
Step 1 - The governing relation. Einstein's equation with stopping potential V0: eV0 = hnu - W0. Rearranging, V0 = (h/e)*nu - (W0/e).
Step 2 - Choose the graph. Because nu = c/lambda, the incident frequency is known from the wavelength. Plotting V0 (y-axis) against nu (x-axis) gives a straight line with:
- slope = h/e,
- y-intercept = -W0/e (and x-intercept = threshold frequency nu0).
Step 3 - Extract h. Measure the slope of the line, slope = (change in V0)/(change in nu). Then
h = e x slope, with e = 1.6 x 10^-19 C.
…
Unlock everything free for 14 days
- Full step-by-step solutions
- Concept-first explanations
- Methods, shortcuts & mistakes
- PYQ mapping + timed mock tests
Full access for 14 days. No credit card required.