Q.Describe diagrammatic representation of age structure showing declining population.
You're viewing a preview — the full solution, concept, methods & PYQ mapping are locked.
Start your 14-day free trial to unlock the full solution →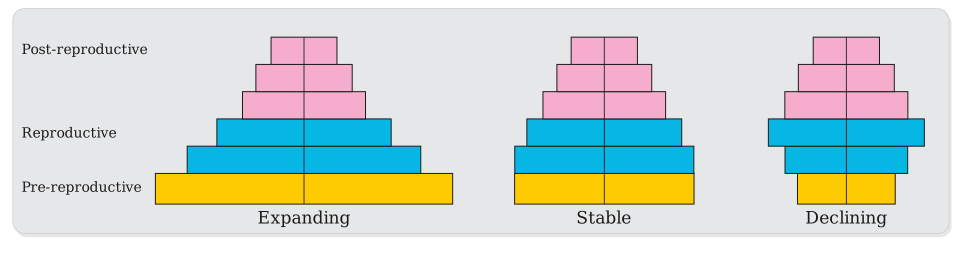
A declining population's pyramid is urn-shaped, with more older individuals than young, reflecting a death rate exceeding the birth rate.
An age-structure diagram plots the proportion of individuals in a population belonging to the pre-reproductive, reproductive, and post-reproductive age groups, usually as stacked horizontal bars. In a declining population, the birth rate is lower than the death rate, so fewer young individuals are being added than the number of older individuals present. This produces a pyramid that is narrow at its base (a small pre-reproductive group), and comparatively wider in its middle and/or upper portions (larger reproductive and post-reproductive groups) — an inverted, urn- or vase-shaped pyramid, in contrast to the broad-based triangular pyramid of an expanding population or the roughly even-width pyramid of a stable population. Such a shap …
Unlock everything free for 14 days
- Full step-by-step solutions
- Concept-first explanations
- Methods, shortcuts & mistakes
- PYQ mapping + timed mock tests
Full access for 14 days. No credit card required.