Chemistry · Ch 6 — Chemical Kinetics
Graphical determination of activation energy
Graphical determination of activation energy
Taking the logarithm of both sides of Eq. (6.18) we obtain
Converting the natural base to base 10 we write
This equation is of the form of a straight line, : the book's term-by-term arrows map to , to the slope , to and to the intercept .
The Arrhenius plot of versus , giving a straight line, is shown in Fig. (6.8). The slope of the line is , with its intercept being .
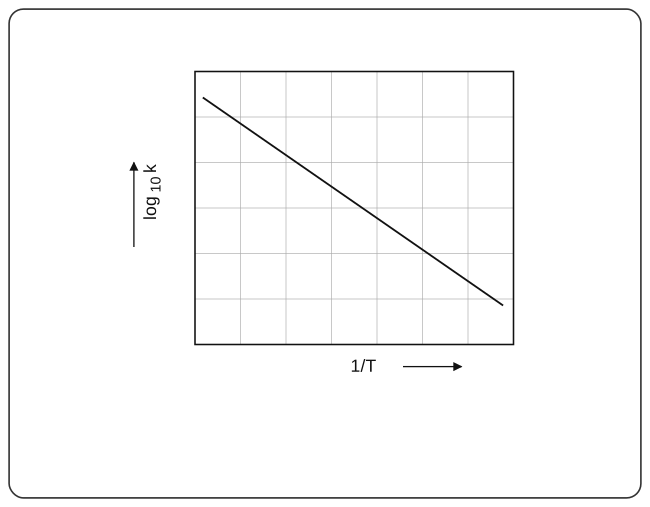
Drawn by us to help you understand the concept clearly, and verified to make sure it's accurate. For exams, practice from your textbook's own diagram.
What this figure shows. Eq. (6.20) says depends linearly on — so plotting against gives a straight line. The line falls (larger = lower temperature = smaller ); its slope equals , and its intercept on the y-axis equals . Measuring the slope of …
…