Q.What is sigmoid curve ?
You're viewing a preview — the full solution, concept, methods & PYQ mapping are locked.
Start your 14-day free trial to unlock the full solution →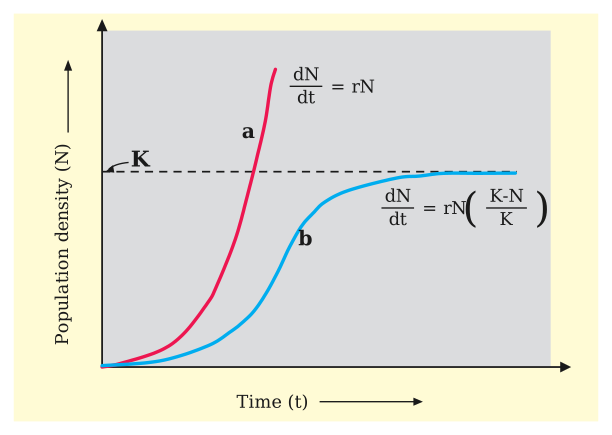
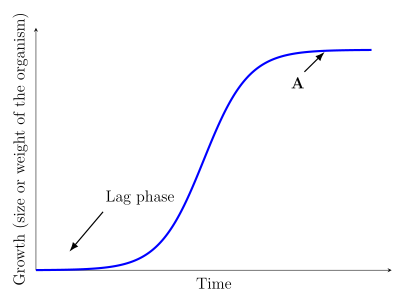
The sigmoid curve is the S-shaped logistic growth curve a population follows as it approaches the carrying capacity (K) of its environment.
In nature, no population has unlimited resources indefinitely; food, space and other resources become limiting as population size grows. The pattern of growth under such limited-resource conditions, when plotted as population size (N) against time, produces a characteristic S-shaped (sigmoid) curve, described by the Verhulst-Pearl logistic growth equation:
dN/dt = rN (1 - N/K)
where N = population size, r = intrinsic rate of natural increase, t = time, and K = carrying capacity (the maximum population size the environment can sustain).
Phases of the sigmoid curve:
- Lag phase -- growth is slow initially as the population establishes itself.
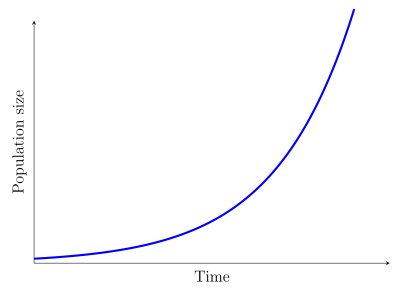
- Exponential (log) phase -- growth accelerates rapidly as resources are still abundant and the (1 - N/K) term is close to 1. …
Unlock everything free for 14 days
- Full step-by-step solutions
- Concept-first explanations
- Methods, shortcuts & mistakes
- PYQ mapping + timed mock tests
Full access for 14 days. No credit card required.