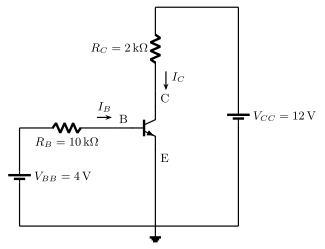
Q.Illustration 1: Find the end points of the load line for the circuit given (figure 2.1.4).
[!TLDR]
The DC load line runs between on the x-axis and on the y-axis.
The DC load line is the straight line drawn on the output characteristics that contains every possible operating point fixed by the collector-circuit elements and the supply. Its two extreme points are the cutoff point (on the axis) and the saturation point (on the axis).
Applying Kirchhoff's voltage law to the collector loop of figure 2.1.4:
Cutoff point (x-axis). Under cutoff no collector current flows, so put :
Saturation point (y-axis). Under saturation the collector-emitter voltage is zero, so put :
Joining the point on the x-axis to the point on the y-axis gives the DC load line shown in figure 2.1.5.
[!ANSWER]
End points of the load line: (x-axis) and (y-axis).
Unlock everything free for 14 days
- Full step-by-step solutions
- Concept-first explanations
- Methods, shortcuts & mistakes
- PYQ mapping + timed mock tests
Full access for 14 days. No credit card required.