Question 17 of 48
Q.Study the following figure and answer the question given below it.
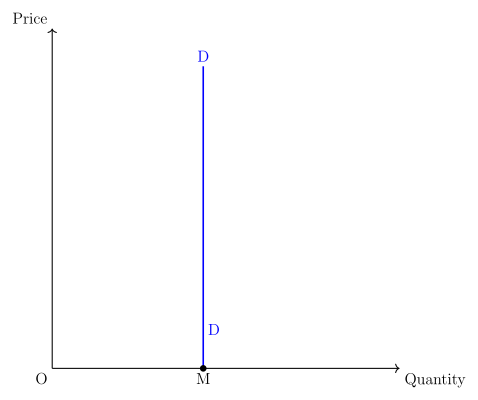
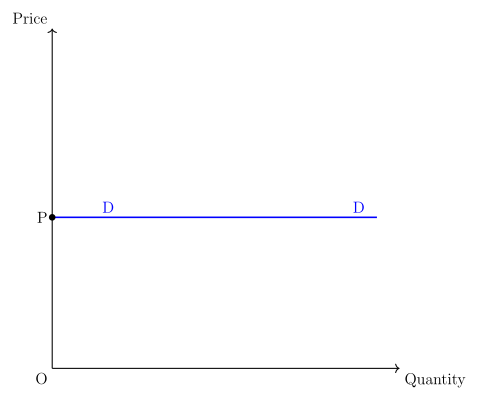
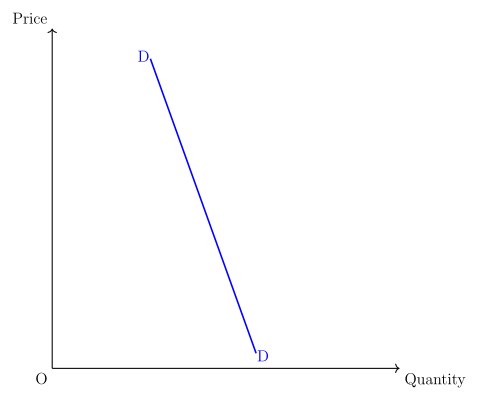
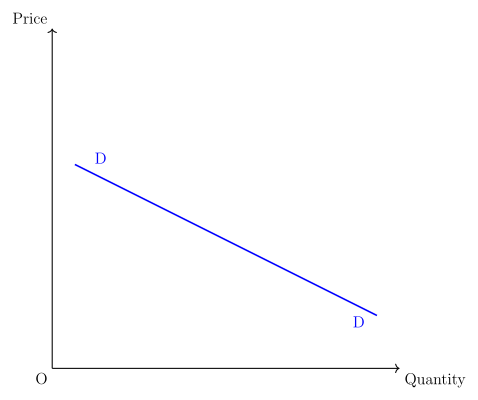
Identify the price elasticity of demand from the following diagram:
(a) Perfectly inelastic demand
(b) Perfectly elastic demand
(c) Relatively inelastic demand
(d) Relatively elastic demand/unitary elastic
Maharashtra MsbshseMaharashtra HSC (MSBSHSE) Board 2022MCQ· 1mImportance★★★★★
35% · 17/48 Questions
You're viewing a preview — the full solution, concept, methods & PYQ mapping are locked.
Start your 14-day free trial to unlock the full solution →Read the slope: vertical = perfectly inelastic, horizontal = perfectly elastic, steep = relatively inelastic, flat/rectangular-hyperbola = relatively/unitary elastic. For a vertical curve the answer is perfectly inelastic demand.
Each diagram in this section shows one degree of price elasticity of demand, identified from the shape of the demand curve:
- Perfectly inelastic demand (Ed = 0): the demand curve is a vertical straight line — quantity stays the same whatever the price.
- Perfectly elastic demand (Ed = infinity): the demand curve is a horizontal straight line — at one price buyers take any quantity.
- Relatively inelastic demand (Ed less than 1): the curve is steep — a large price change causes only a small change in quantity. …
Unlock everything free for 14 days
- Full step-by-step solutions
- Concept-first explanations
- Methods, shortcuts & mistakes
- PYQ mapping + timed mock tests
Full access for 14 days. No credit card required.