Question 37 of 48
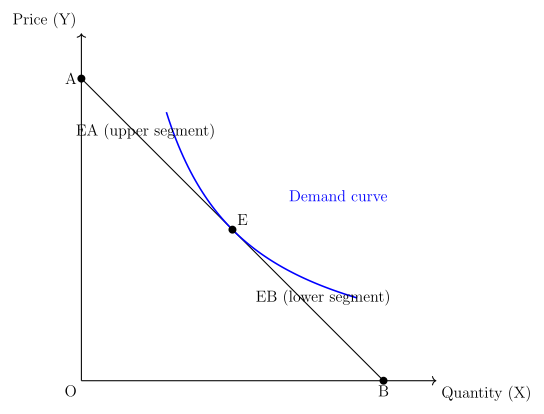
Q.Observe the following diagram of the non-linear demand curve and answer the questions given below.
If EB = EA (Ed = 1) = ______
If EB > EA (Ed > 1) = ______
If EB < EA (Ed < 1) = ______
The ‘x’ axis represents ______ of commodity and ‘y’ axis represents ______ of commodity.
Maharashtra MsbshseMaharashtra HSC (MSBSHSE) Board 2025Subjective· 4mImportance★★★★★
77% · 37/48 Questions
You're viewing a preview — the full solution, concept, methods & PYQ mapping are locked.
Start your 14-day free trial to unlock the full solution →On a straight-line demand curve the point method gives Ed = lower segment (EB) / upper segment (EA): EB = EA → Ed = 1 (unitary, mid-point); EB > EA → Ed > 1 (elastic); EB < EA → Ed < 1 (inelastic). X-axis = quantity demanded, Y-axis = price.
Point (geometric) method of measuring elasticity
At any point E on the demand curve, elasticity is measured as the ratio of the lower segment to the upper segment of the curve:
Ed = lower segment (EB) / upper segment (EA)
Using this rule the blanks are filled as:
- If EB = EA, then Ed = 1 — demand is unitary elastic, which occurs at the mid-point of the demand curve.
- If EB > EA, then Ed > 1 — demand is elastic (relatively elastic), which occurs on the upper part of the curve (above the mid-point, nearer the Y-axis). …
Unlock everything free for 14 days
- Full step-by-step solutions
- Concept-first explanations
- Methods, shortcuts & mistakes
- PYQ mapping + timed mock tests
Full access for 14 days. No credit card required.