Q.Study the following figure and answer the question given below it.
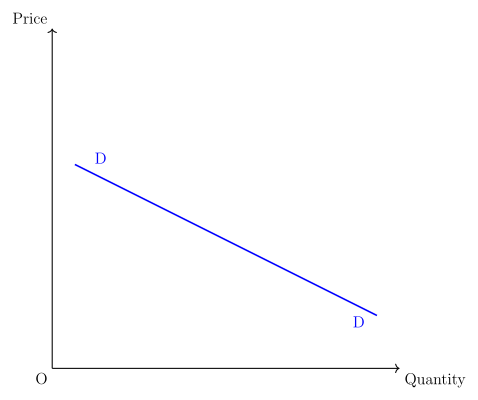
Identify the price elasticity of demand from the following diagram:
🔒You're viewing a preview — the full solution, concept, methods & PYQ mapping are locked.
🔒 Start your 14-day free trial to unlock the full solution →Concept understanding — Price Elasticity of Demand
Knowing that demand falls when price rises isn't enough — the real question is HOW MUCH it falls, and that's exactly what price elasticity of demand measures.
The percentage-change method gives you a precise number. Take the percentage change in quantity demanded, divide by the percentage change in price, and (ignoring the sign, since demand curves slope down) that ratio IS the elasticity, Ed. A value above 1 means demand is relatively elastic — quantity reacts more than proportionally to the price change. Exactly 1 is unit elastic. Below 1 (but still positive) is relatively inelastic — quantity barely budges. The two extremes: perfectly elastic (Ed = infinity, any tiny price rise kills demand entirely) and perfectly inelastic (Ed = 0, quantity demanded doesn't move at all, no matter what the price does).
When you don't have exact numbers, the total-expenditure method is a clever shortcut. Total expenditure is just price times quantity, and watching how it moves when price changes tells you the elasticity category without ever computing Ed directly. Price falls and total expenditure RISES? That only happens if quantity rose by MORE than price fell proportionally — demand is elastic. Price falls and expenditure stays exactly the same? Unit elastic — the two effects cancel perfectly. Price falls and expenditure FALLS too? Quantity barely responded — demand is inelastic. …
The answer is read from the demand curve's shape: a flatter downward-sloping curve indicates relatively elastic demand (Ed greater than 1), and a rectangular hyperbola indicates unitary elastic demand (Ed = 1), where quantity demanded changes as much as or more than price. …
A flatter curve = relatively elastic demand (Ed greater than 1); a rectangular hyperbola = unitary elastic (Ed = 1). Match the diagram's shape to read the degree.
Degrees of price elasticity identified from the diagram:
- Relatively elastic demand (Ed greater than 1): a flatter curve — a small price change causes a larger change in quantity demanded (luxuries behave this way).
- Unitary elastic demand (Ed = 1): a rectangular hyperbola — quantity demanded changes exactly in proportion to the price change. …
- CBSE 2026Set ANNUAL1 markMCQQ.Demand curve is parallel to ‘Y’-axis - Perfectly inelastic demand Relatively inelastic demand Perfectly elastic demand Unitary elastic demand(a) c, d(b) b, d(c) a, b, c(d) only a
›Reveal solutionSolution
A vertical demand curve parallel to the Y-axis = perfectly inelastic demand, so the answer is only a.
A demand curve parallel to the Y-axis is a vertical straight line: whatever the price, the quantity demanded stays exactly the same. This means the coefficient of price elasticity of demand is zero (Ed = 0) because there is no change in quantity in response to a change in price. That degree of elasticity is called perfectly inelastic demand (statement a).
…
- CBSE 2025Set ANNUAL1 markQ.Give an economic term: Elasticity resulting from a proportionate change in quantity demanded due to a proportionate change in price.
›Reveal solutionSolution
The economic term is Unitary (unit) elasticity of demand, where Ed = 1.
Price elasticity of demand is measured as Ed = percentage change in quantity demanded / percentage change in price. When a given percentage change in price brings about an exactly equal percentage change in quantity demanded, this ratio equals one. This case is called unitary elastic demand. Its notable feature is that the total expenditure (total outlay) on t …
- CBSE 2024Set ANNUAL1 markQ.Perfectly elastic demand : Ed = ∞ : : _______ : Ed = 0
›Reveal solutionSolution
Completing the correlation: Perfectly inelastic demand : Ed = 0 :: Perfectly elastic demand : Ed = infinity. Answer: Perfectly inelastic demand.
Why: The degrees of price elasticity of demand are:
- Perfectly elastic demand (Ed = infinity) — an infinitely large change in quantity for a negligible change in price; the demand curve is a horizontal line.
- Perfectly inelastic demand (Ed = 0) — quantity demanded stays exactly the same whatever the price; the demand curve is a vertical line. …
- CBSE 2023Set ANNUAL1 markQ.Give economic terms: Degree of responsiveness of a change of quantity demanded of a good to a change in its price.
›Reveal solutionSolution
The term described is Price Elasticity of Demand — the responsiveness of the quantity demanded of a good to a change in its price.
Price elasticity of demand shows how much the quantity demanded changes when the price of the good changes. It is measured as the ratio of the percentage change in quantity demanded to the percentage change in price, i.e. Ed = %ΔQ / %ΔP. If demand responds sharply to a price change, demand is elastic; if it barely responds, demand is inelastic …
- CBSE 2022Set ANNUAL1 markQ.Complete the correlation. Perfectly elastic demand : Ed = ∞ :: ______ : Ed = 1.
›Reveal solutionSolution
The missing term is Unitary elastic demand, the degree of elasticity where the coefficient Ed = 1.
Price elasticity of demand measures how responsive quantity demanded is to a price change, and its coefficient defines five degrees:
Degree Coefficient Perfectly elastic Ed = infinity Perfectly inelastic Ed = 0 Relatively elastic Ed greater than 1 Relatively inelastic Ed less than 1 Unitary elastic Ed = 1 … - CBSE 2022Set ANNUAL1 markMCQQ.When the percentage change in quantity demanded is Less than the percentage change in price the demand curve is ______(a) Flatter(b) Steeper(c) Rectangular hyperbola(d) Horizontal
›Reveal solutionSolution
The correct option is Steeper. When the percentage change in quantity demanded is less than the percentage change in price, demand is relatively inelastic (Ed less than 1) and its curve is comparatively steep.
The slope of the demand curve reflects the degree of elasticity:
Situation Ed Curve %ΔQ greater than %ΔP Ed greater than 1 (relatively elastic) Flatter %ΔQ less than %ΔP Ed less than 1 (relatively inelastic) Steeper - CBSE 2022Set ANNUAL1 markMCQQ.Study the following figure and answer the question given below it. Identify the price elasticity of demand from the following diagram:(a) Perfectly inelastic demand(b) Perfectly elastic demand(c) Relatively inelastic demand(d) Relatively elastic demand/unitary elastic
›Reveal solutionSolution
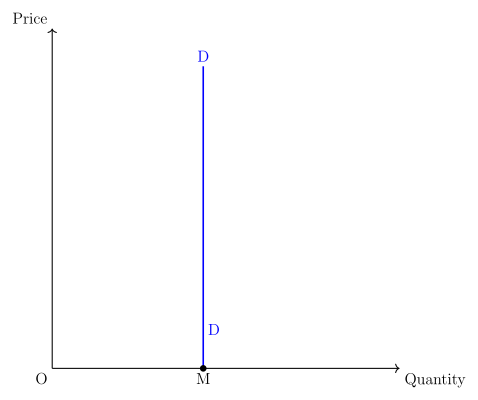
Read the slope: vertical = perfectly inelastic, horizontal = perfectly elastic, steep = relatively inelastic, flat/rectangular-hyperbola = relatively/unitary elastic. For a vertical curve the answer is perfectly inelastic demand.
Each diagram in this section shows one degree of price elasticity of demand, identified from the shape of the demand curve:
- Perfectly inelastic demand (Ed = 0): the demand curve is a vertical straight line — quantity stays the same whatever the price.
- Perfectly elastic demand (Ed = infinity): the demand curve is a horizontal straight line — at one price buyers take any quantity.
- Relatively inelastic demand (Ed less than 1): the curve is steep — a large price change causes only a small change in quantity. …
- CBSE 2022Set ANNUAL1 markMCQQ.Study the following figure and answer the question given below it. Identify the price elasticity of demand from the following diagram:(a) Perfectly inelastic demand(b) Perfectly elastic demand(c) Relatively inelastic demand(d) Relatively elastic demand/unitary elastic
›Reveal solutionSolution
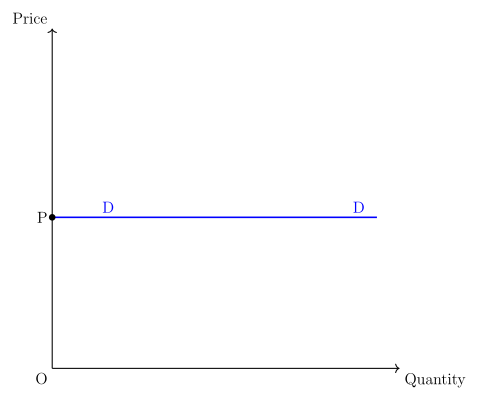
A horizontal demand curve = perfectly elastic demand (Ed = infinity). Match the diagram's slope to identify the degree.
The four degrees identified from a demand-curve diagram are:
- Perfectly elastic demand (Ed = infinity): a horizontal straight line — the whole quantity is bought at one price, and demand vanishes if price rises.
- Perfectly inelastic demand (Ed = 0): a vertical straight line — quantity is fixed regardless of price.
- Relatively inelastic demand (Ed less than 1): a steep curve — quantity changes little when price changes. …
- CBSE 2022Set ANNUAL1 markMCQQ.Study the following figure and answer the question given below it. Identify the price elasticity of demand from the following diagram:(a) Perfectly inelastic demand(b) Perfectly elastic demand(c) Relatively inelastic demand(d) Relatively elastic demand/unitary elastic
›Reveal solutionSolution
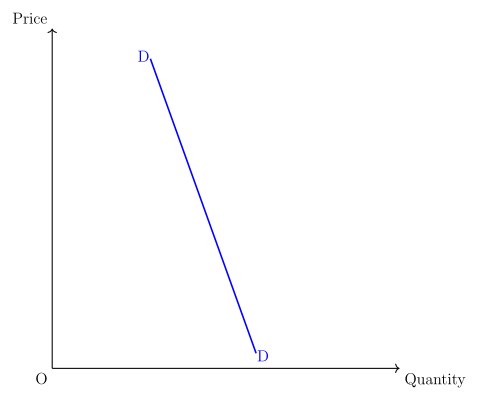
A steep downward-sloping demand curve = relatively inelastic demand (Ed less than 1). Identify the degree from the curve's slope.
Degrees of price elasticity read from the diagram:
- Relatively inelastic demand (Ed less than 1): a steep curve — quantity demanded changes proportionately less than price (necessities behave this way).
- Relatively elastic / unitary demand (Ed of 1 or more): a flatter curve — quantity changes proportionately as much as or more than price.
- Perfectly inelastic demand (Ed = 0): a vertical line. …
- CBSE 2022Set ANNUAL1 markMCQQ.Study the following figure and answer the question given below it. Identify the price elasticity of demand from the following diagram:(a) Perfectly inelastic demand(b) Perfectly elastic demand(c) Relatively inelastic demand(d) Relatively elastic demand/unitary elastic
›Reveal solutionSolution
A flatter curve = relatively elastic demand (Ed greater than 1); a rectangular hyperbola = unitary elastic (Ed = 1). Match the diagram's shape to read the degree.
Degrees of price elasticity identified from the diagram:
- Relatively elastic demand (Ed greater than 1): a flatter curve — a small price change causes a larger change in quantity demanded (luxuries behave this way).
- Unitary elastic demand (Ed = 1): a rectangular hyperbola — quantity demanded changes exactly in proportion to the price change. …
🎓Unlock everything free for 14 days
- ✓Full step-by-step solutions
- ✓Concept-first explanations
- ✓Methods, shortcuts & mistakes
- ✓PYQ mapping + timed mock tests
Full access for 14 days. No credit card required.