Chemistry · Ch 2 — Solutions
Boiling Point Elevation as a Consequence of Vapour Pressure Lowering
Boiling Point Elevation as a Consequence of Vapour Pressure Lowering
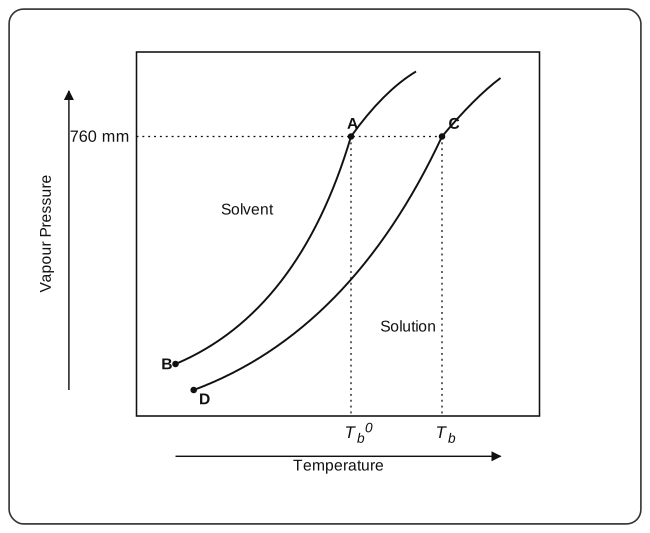
To understand the elevation of boiling point, let us compare the vapour pressures of the solution and those of the pure solvent. The vapour pressures of the solution and of the pure solvent are plotted as a function of temperature, as shown in Fig. 2.6.
Drawn by us to help you understand the concept clearly, and verified to make sure it's accurate. For exams, practice from your textbook's own diagram.
What this figure shows. Vapour pressure (y-axis) against temperature (x-axis). Two rising curves are drawn: the upper one for the pure solvent (running from point B up through point A) and the lower one for the solution (from point D up through point C), the solution curve lying below the solvent curve at every temperature. A horizontal dotted line at 760 mm cuts the solvent curve at A and the solution curve at C; dotted verticals dropped from these intersections mark (boiling point of the pure solvent) and $T …
As stated in section 2.7, at any temperature the vapour pressure of the solution is lower than that of the pure solvent. Hence, the vapour pressure-temperature curve of the solution (CD) lies below that of the solvent (AB). The difference between the two vapour pressures increases as temperature and vapour pressure increase, as predicted by the equation .
The intersection of the curve CD with the line corresponding to 760 mm is the boiling point of the solution. The similar intersection of the curve AB is the boiling point of the pure solvent. It is clear from the figure that the boiling point () of the solution is higher than that of the pure solvent (). …