Question 126 of 126
Q.Draw one PV diagram each for
(i) isothermal process,
(ii) isobaric process and
(iii) isochoric process.
Puducherry TnboardTamil Nadu HSC First Year (DGE) Board 2026Subjective· 3mImportance★★★★★
100% · 126/126 Questions
You're viewing a preview — the full solution, concept, methods & PYQ mapping are locked.
Start your 14-day free trial to unlock the full solution →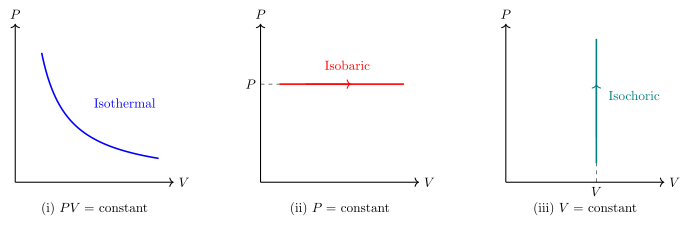
On a P-V diagram, an isothermal process traces a hyperbola (PV = constant), an isobaric process traces a horizontal line (constant P), and an isochoric process traces a vertical line (constant V).
A PV (pressure-volume) diagram plots pressure P on the vertical axis against volume V on the horizontal axis, and the shape of the curve for a thermodynamic process shows how P and V vary together during that process.
- Isothermal process (constant temperature): Since T is constant, PV = mu*RT = constant, so P = constant/V. This is a rectangular hyperbola — as V increases, P decreases smoothly, and the curve never touches either axis. On the PV diagram, this appears as a smooth downward-curving line from the upper-left (high P, low V) to the lower-right (low P, high V).
- Isobaric process (constant pressure): Since P is held fixed while V changes (e.g., a gas expanding at constant pressure as it's heated), the graph is a horizontal straight line at the height P = constant, with V increasing (or decreasing) along that line. …
Unlock everything free for 14 days
- Full step-by-step solutions
- Concept-first explanations
- Methods, shortcuts & mistakes
- PYQ mapping + timed mock tests
Full access for 14 days. No credit card required.