Mathematics · Ch 9 — Applications of Integration
Area of the Region Bounded Between Two Curves
Area of the Region Bounded Between Two Curves
Case (i): between two curves, integrating in . Let and be curves with for all . The region bounded between them and the ordinates is divided into thin vertical strips of width and height . Summing and passing to the limit,
Calling the upper curve (, viewed in the positive -direction) and the lower curve (), this is written .
Case (ii): between two curves, integrating in . Let and with for all . Viewing in the positive -direction, calling the right curve () and the left curve (),
General working rule (no need to name curves globally as upper/lower). For a region bounded by , and the lines (): draw an arbitrary vertical line cutting the region; let be the -value where the line enters the region and where it exits (both read off the bounding curves' equations at that ). Then
The mirror rule (region bounded by and , ): draw a horizontal line, find and , and
Recurring worked patterns (Examples 9.47-9.61). The area of an ellipse is (circle, : ); the area between the parabola and its latus rectum () is — Archimedes' formula, two-thirds the area of the enclosing rectangle (base = latus rectum, height = distance from vertex to the latus rectum), and equivalently four-thirds the area of the inscribed triangle, exactly the ratio proved in §9.1; a triangle's area can be found purely by integration by writing each side as a line and adding/subtracting the areas under them; and the region between a tangent and normal to a circle can be computed by either vertical or horizontal strips, giving the same value both ways — a useful self-check. …
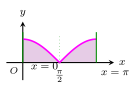
Drawn by us to help you understand the concept clearly, and verified to make sure it's accurate. For exams, practice from your textbook's own diagram.
What this figure shows. Fig. 9.22 — Example 9.53: the region bounded by , the x-axis and the lines , (two arches meeting at the cusp $x=\f …
![Fig. 9.23 — Fig. 9.23 — Area of the region between two curves $y=f(x)$ (upper) and $y=g(x)$ (lower) with $f(x)\ge g(x)$ on $[a,b]$; vertical strip of height $f(x)-g(x)$](/figures/applications-of-integration/area-between-two-curves-fig-9-23.svg)
Drawn by us to help you understand the concept clearly, and verified to make sure it's accurate. For exams, practice from your textbook's own diagram.
What this figure shows. Fig. 9.23 — Area of the region between two curves (upper) and (lower) with on ; vertical strip of heig …
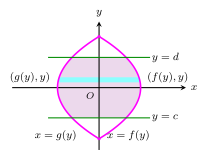
Drawn by us to help you understand the concept clearly, and verified to make sure it's accurate. For exams, practice from your textbook's own diagram.
What this figure shows. Schematic of the area bounded between two curves x=f(y) and x=g(y) and the lines y=c and y=d, divided into thin horizontal strips (Case ii integration wit …
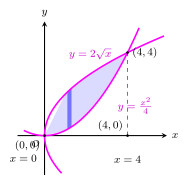
Drawn by us to help you understand the concept clearly, and verified to make sure it's accurate. For exams, practice from your textbook's own diagram.
What this figure shows. Area of the region bounded between the parabolas y^2=4x and x^2=4y from (0,0) to (4,4), shaded with a thin vertical strip; upper boundary y=2 sqrt(x), lower b …
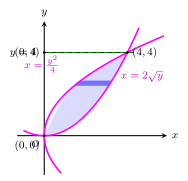
Drawn by us to help you understand the concept clearly, and verified to make sure it's accurate. For exams, practice from your textbook's own diagram.
What this figure shows. Area of the region bounded between the parabolas y^2=4x and x^2=4y from (0,0) to (4,4), shaded with a thin horizontal strip; right boundary x=2 sqrt(y), left b …
Drawn by us to help you understand the concept clearly, and verified to make sure it's accurate. For exams, practice from your textbook's own diagram.
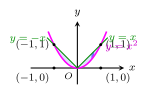
What this figure shows. Area of the region bounded between the parabola x^2=y and the curve y=|x|, lying in the first and second quadrants, bounded by y=x and y=-x, shaded with a thin …
Drawn by us to help you understand the concept clearly, and verified to make sure it's accurate. For exams, practice from your textbook's own diagram.
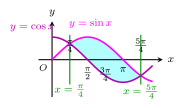
What this figure shows. Area of the region bounded by y=cos x and y=sin x between the lines x=pi/4 and x=5pi/4, shaded where sin x is abo …
Drawn by us to help you understand the concept clearly, and verified to make sure it's accurate. For exams, practice from your textbook's own diagram.
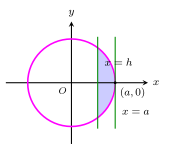
What this figure shows. The circle x^2+y^2=a^2 divided into two segments by the line x=h; the smaller segment (to the right of x=h, up to x=a) …
Drawn by us to help you understand the concept clearly, and verified to make sure it's accurate. For exams, practice from your textbook's own diagram.
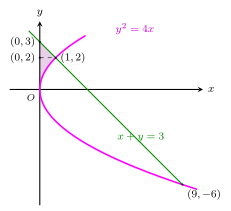
What this figure shows. Area of the region in the first quadrant bounded by the parabola y^2=4x, the line x+y=3 and the y-axis; intersection points (1,2) and ( …
Drawn by us to help you understand the concept clearly, and verified to make sure it's accurate. For exams, practice from your textbook's own diagram.
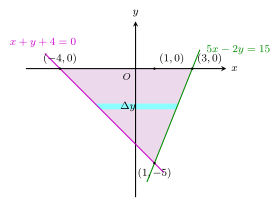
What this figure shows. Area of the triangular region bounded by the lines 5x-2y=15, x+y+4=0 and the x-axis, lying below the x-axis with vertices (3,0), (-4,0) and (1,-5); a horizontal strip of widt …
Drawn by us to help you understand the concept clearly, and verified to make sure it's accurate. For exams, practice from your textbook's own diagram.
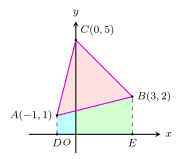
What this figure shows. Area of triangle ABC with vertices A(-1,1), B(3,2), C(0,5) found by integration, split into region DACO and region OCBE (feet D and E on …
Drawn by us to help you understand the concept clearly, and verified to make sure it's accurate. For exams, practice from your textbook's own diagram.
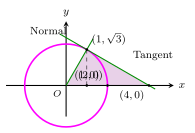
What this figure shows. Area bounded by the x-axis, the tangent and the normal to the circle x^2+y^2=4 drawn at (1,sqrt 3); the tangent meets the x-axis at (4,0) and the normal passes th …