Skip to content

Mathematics · Ch 9 — Applications of Integration

Area of the Region Bounded by a Curve, y-axis and the Lines y=c, y=d

9.8.2

Area of the Region Bounded by a Curve, y-axis and the Lines y=c, y=d

The mirror-image formulas for a curve related to the yy-axis, obtained by the same strip argument with the roles of xx and yy interchanged.

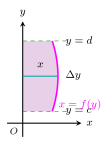
Case (iv): curve to the right of the yy-axis. Let x=f(y)x=f(y), c≤y≤dc\le y\le d, lie entirely to the right of the yy-axis (first/fourth quadrant), so x≥0x\ge0 throughout. Viewing in the positive xx-direction, divide the region bounded by the curve, the yy-axis, and y=c, y=dy=c,\,y=d into thin horizontal strips of length xx and width Δy\Delta y:

A=lim⁡∑x Δy=∫cdx dy.A=\lim\sum x\,\Delta y=\int_c^d x\,dy.

Case (v): curve to the left of the yy-axis. If x=f(y)x=f(y) lies entirely to the left of the yy-axis (second/third quadrant), so x≤0x\le0 throughout, each strip has length −x-x:

A=lim⁡∑(−x)Δy=−∫cdx dy.A=\lim\sum(-x)\Delta y=-\int_c^d x\,dy.

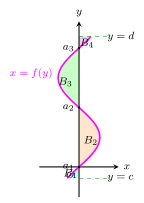
Case (vi): curve crosses the yy-axis. If x=f(y)x=f(y) takes both signs on [c,d][c,d], split at the crossing points a1,a2,…,aka_1,a_2,\ldots,a_k into constant-sign pieces and add:

A=∣∫ca1f(y) dy∣+∣∫a1a2f(y) dy∣+⋯+∣∫akdf(y) dy∣.A=\left|\int_c^{a_1}f(y)\,dy\right|+\left|\int_{a_1}^{a_2}f(y)\,dy\right|+\cdots+\left|\int_{a_k}^{d}f(y)\,dy\right|.

Figure 9.11Fig. 9.11 — Area of the region bounded by a curve $x=f(y)$ (to the right of the y-axis), the y-axis and the lines $y=c$, $y=d$, using horizontal strips of width $\Delta y$ and length $x$
Fig. 9.11 — Fig. 9.11 — Area of the region bounded by a curve $x=f(y)$ (to the right of the y-axis), the y-axis and the lines $y=c$, $y=d$, using horizontal strips of width $\Delta y$ and length $x$

Drawn by us to help you understand the concept clearly, and verified to make sure it's accurate. For exams, practice from your textbook's own diagram.

What this figure shows. Fig. 9.11 — Area of the region bounded by a curve x=f(y)x=f(y) (to the right of the y-axis), the y-axis and the lines y=cy=c, y=dy=d, using horizontal strips of width $\Delta …
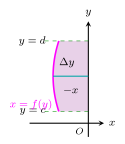
Figure 9.12Fig. 9.12 — Area of the region bounded by a curve $x=f(y)$ (to the left of the y-axis), the y-axis and the lines $y=c$, $y=d$; horizontal strip length $|x|=-x$
Fig. 9.12 — Fig. 9.12 — Area of the region bounded by a curve $x=f(y)$ (to the left of the y-axis), the y-axis and the lines $y=c$, $y=d$; horizontal strip length $|x|=-x$

Drawn by us to help you understand the concept clearly, and verified to make sure it's accurate. For exams, practice from your textbook's own diagram.

What this figure shows. Fig. 9.12 — Area of the region bounded by a curve x=f(y)x=f(y) (to the left of the y-axis), the y-axis and the lines y=cy=c, y=dy=d; horizontal strip l …

…

Figure 9.13Fig. 9.13 — A curve $x=f(y)$ lying alternately to the right and left of the y-axis between $y=c$ and $y=d$, giving geometric areas $B_1$, $B_2$, $B_3$, $B_4$ separated by $a_1$, $a_2$, $a_3$
Fig. 9.13 — Fig. 9.13 — A curve $x=f(y)$ lying alternately to the right and left of the y-axis between $y=c$ and $y=d$, giving geometric areas $B_1$, $B_2$, $B_3$, $B_4$ separated by $a_1$, $a_2$, $a_3$

Drawn by us to help you understand the concept clearly, and verified to make sure it's accurate. For exams, practice from your textbook's own diagram.

What this figure shows. Fig. 9.13 — A curve x=f(y)x=f(y) lying alternately to the right and left of the y-axis between y=cy=c and y=dy=d, giving geometric areas B1B_1, B2B_2, B3B_3, B4B_4 separated by …

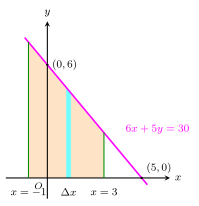
Figure 9.14Fig. 9.14 — Example 9.47: the region bounded by the line $6x+5y=30$, the x-axis and the lines $x=-1$, $x=3$ (lies above the x-axis)
Fig. 9.14 — Fig. 9.14 — Example 9.47: the region bounded by the line $6x+5y=30$, the x-axis and the lines $x=-1$, $x=3$ (lies above the x-axis)

Drawn by us to help you understand the concept clearly, and verified to make sure it's accurate. For exams, practice from your textbook's own diagram.

What this figure shows. Fig. 9.14 — Example 9.47: the region bounded by the line 6x+5y=306x+5y=30, the x-axis and the lines x=−1x=-1, x=3x=3 (lies above t …

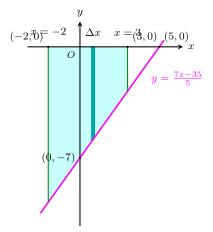
Figure 9.15Fig. 9.15 — Example 9.48: the region bounded by the line $7x-5y=35$, the x-axis and the lines $x=-2$, $x=3$ (lies below the x-axis)
Fig. 9.15 — Fig. 9.15 — Example 9.48: the region bounded by the line $7x-5y=35$, the x-axis and the lines $x=-2$, $x=3$ (lies below the x-axis)

Drawn by us to help you understand the concept clearly, and verified to make sure it's accurate. For exams, practice from your textbook's own diagram.

What this figure shows. Fig. 9.15 — Example 9.48: the region bounded by the line 7x−5y=357x-5y=35, the x-axis and the lines x=−2x=-2, x=3x=3 (lies below t …

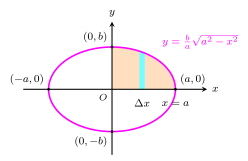
Figure 9.16Fig. 9.16 — Example 9.49: the ellipse $\frac{x^{2}}{a^{2}}+\frac{y^{2}}{b^{2}}=1$; area found as four times the first-quadrant region using vertical strips $\Delta x$, with $y=\frac{b}{a}\sqrt{a^{2}-x^{2}}$
Fig. 9.16 — Fig. 9.16 — Example 9.49: the ellipse $\frac{x^{2}}{a^{2}}+\frac{y^{2}}{b^{2}}=1$; area found as four times the first-quadrant region using vertical strips $\Delta x$, with $y=\frac{b}{a}\sqrt{a^{2}-x^{2}}$

Drawn by us to help you understand the concept clearly, and verified to make sure it's accurate. For exams, practice from your textbook's own diagram.

What this figure shows. Fig. 9.16 — Example 9.49: the ellipse x2a2+y2b2=1\frac{x^{2}}{a^{2}}+\frac{y^{2}}{b^{2}}=1; area found as four times the first-quadrant region using vertical strips Δx\Delta x, with $y=\frac{b}{ …

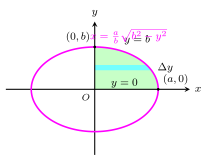
Figure 9.17Fig. 9.17 — Example 9.49: the same ellipse, area found with horizontal strips $\Delta y$ in the first quadrant, with $x=\frac{a}{b}\sqrt{b^{2}-y^{2}}$
Fig. 9.17 — Fig. 9.17 — Example 9.49: the same ellipse, area found with horizontal strips $\Delta y$ in the first quadrant, with $x=\frac{a}{b}\sqrt{b^{2}-y^{2}}$

Drawn by us to help you understand the concept clearly, and verified to make sure it's accurate. For exams, practice from your textbook's own diagram.

What this figure shows. Fig. 9.17 — Example 9.49: the same ellipse, area found with horizontal strips Δy\Delta y in the first quadrant, with $x=\frac{a}{b}\sqrt{ …
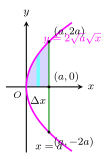
Figure 9.18Fig. 9.18 — Example 9.50: the region between the parabola $y^{2}=4ax$ and its latus rectum $x=a$; first-quadrant area under $y=2\sqrt{a}\sqrt{x}$ by vertical strips $\Delta x$
Fig. 9.18 — Fig. 9.18 — Example 9.50: the region between the parabola $y^{2}=4ax$ and its latus rectum $x=a$; first-quadrant area under $y=2\sqrt{a}\sqrt{x}$ by vertical strips $\Delta x$

Drawn by us to help you understand the concept clearly, and verified to make sure it's accurate. For exams, practice from your textbook's own diagram.

What this figure shows. Fig. 9.18 — Example 9.50: the region between the parabola y2=4axy^{2}=4ax and its latus rectum x=ax=a; first-quadrant area under y=2axy=2\sqrt{a}\sqrt{x} by vertical s …

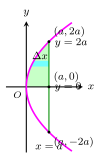
Figure 9.19Fig. 9.19 — Example 9.50: the same region between the parabola $y^{2}=4ax$ and its latus rectum $x=a$, computed with horizontal strips of length $(a-x)$
Fig. 9.19 — Fig. 9.19 — Example 9.50: the same region between the parabola $y^{2}=4ax$ and its latus rectum $x=a$, computed with horizontal strips of length $(a-x)$

Drawn by us to help you understand the concept clearly, and verified to make sure it's accurate. For exams, practice from your textbook's own diagram.

What this figure shows. Fig. 9.19 — Example 9.50: the same region between the parabola y2=4axy^{2}=4ax and its latus rectum x=ax=a, computed with horizontal strips of l …
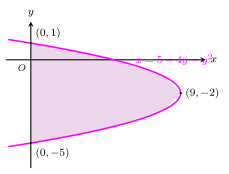
Figure 9.20Fig. 9.20 — Example 9.51: the region bounded by the y-axis and the parabola $x=5-4y-y^{2}$ (vertex $(9,-2)$), crossing the y-axis at $(0,1)$ and $(0,-5)$
Fig. 9.20 — Fig. 9.20 — Example 9.51: the region bounded by the y-axis and the parabola $x=5-4y-y^{2}$ (vertex $(9,-2)$), crossing the y-axis at $(0,1)$ and $(0,-5)$

Drawn by us to help you understand the concept clearly, and verified to make sure it's accurate. For exams, practice from your textbook's own diagram.

What this figure shows. Fig. 9.20 — Example 9.51: the region bounded by the y-axis and the parabola x=5−4y−y2x=5-4y-y^{2} (vertex (9,−2)(9,-2)), crossing the y-axis at (0,1)(0,1) …

Figure 9.21Fig. 9.21 — Example 9.52: the region bounded by $y=\sin x$, the x-axis and the lines $x=0$, $x=2\pi$ — above the axis on $[0,\pi]$ and below it on $[\pi,2\pi]$
Fig. 9.21 — Fig. 9.21 — Example 9.52: the region bounded by $y=\sin x$, the x-axis and the lines $x=0$, $x=2\pi$ — above the axis on $[0,\pi]$ and below it on $[\pi,2\pi]$

Drawn by us to help you understand the concept clearly, and verified to make sure it's accurate. For exams, practice from your textbook's own diagram.

What this figure shows. Fig. 9.21 — Example 9.52: the region bounded by y=sin⁡xy=\sin x, the x-axis and the lines x=0x=0, x=2πx=2\pi — above the axis on [0,π][0,\pi] and below it o …