Physics · Ch 1 — Electric Charges and Fields
Electric Field Lines
Electric Field Lines
Why Field Lines?
The electric field is a vector — it has both magnitude and direction at every point. Drawing an arrow at every point in space is impractical. Instead, we use electric field lines: a pictorial tool invented by Faraday to visualise the field.
An electric field line is a curve drawn such that the tangent at any point gives the direction of the net electric field at that point. An arrow on the curve shows which way the field points (from the two possible tangent directions).
From a Point Charge: The Radial Picture
For a single point charge placed at the origin:
- The field at any point is radially outward.
- The magnitude decreases as .
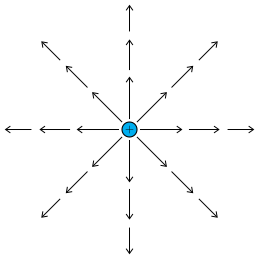
- If we draw arrows of length proportional to , they get shorter as increases.
- Connecting arrows pointing in the same direction gives radial lines all going outward (for ) or inward (for ).
How Field Lines Show Strength: Density, Not Length
When we replace arrows with continuous lines, we lose the length information. But we gain a new measure:
The magnitude of is indicated by the density of field lines — the number of lines per unit area perpendicular to the field.
- Near the charge: lines are crowded (strong field).
- Far from the charge: lines are spread apart (weak field).
The absolute number of lines is irrelevant — only the relative density matters.
The Law from Field Lines
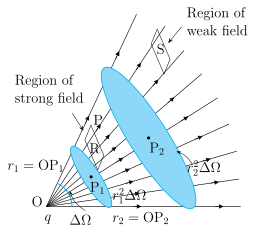
Consider a point charge. Draw a cone (solid angle ) from the charge. At distance , the cone cuts an area . At distance , it cuts .
The same number of field lines passes through both areas. So the number of lines per unit area (the density) is:
- At :
- At :
Since density , we get:
This matches Coulomb's law — the field lines picture is consistent with the mathematics.
Properties of Electric Field Lines
- Start at positive charges, end at negative charges. …
Drawn by us to help you understand the concept clearly, and verified to make sure it's accurate. For exams, practice from your NCERT textbook's own diagram.
The figure is a two-dimensional representation of the electric field around a single positive point charge placed at the origin. It shows eight straight arrows radiating outward from the charge, each pointing directly away from it. The arrows are drawn as discrete, head-to-tail chains — each arrow in a chain is shorter than the previous one, so the chains get progressively thinner as they move away from the charge. This visualises the key idea: the field strength decreases with distance.
What each element represents:
- The central dot: The location of the positive point charge .
- Each arrow (vector): The electric field at the tail of that arrow. The arrow points in the direction of the force on a unit positive test charge placed at that point.
- Arrow length: Proportional to the magnitude of the field at that point. Since the field weakens with distance, arrows farther from the charge are shorter.
- The eight radial directions: The field is spherically symmetric — the same pattern exists in every direction in three dimensions; the figure shows only eight for clarity.
The physical idea taught:
The figure introduces the transition from a vector field (where each point has an arrow) to field lines. By connecting the arrows that point in the same direction, we obtain a continuous curve — a field line. The density of these lines (how closely they are packed) now encodes the field strength: lines are crowded near the charge (strong field) and spread apart far away (weak field). The number of lines crossing a given area is constant, which leads directly to the inverse-square law.
Key formula developed from this figure:
The textbook uses the figure to derive the dependence of the field. For a point charge , the electric field at a distance is:
where:
- is the electric field vector,
- is the permittivity of free space,
- is the source charge,
- is the distance from the charge,
- is the unit vector pointing radially outward from the charge. …
Drawn by us to help you understand the concept clearly, and verified to make sure it's accurate. For exams, practice from your NCERT textbook's own diagram.
What the Figure Shows
The figure is a two-dimensional schematic of the electric field lines radiating from a single positive point charge placed at point O (bottom-left corner). The field lines fan out radially upward and to the right, forming a cone of lines that spreads as distance increases. Two small area elements are drawn perpendicular to the field lines:
- Element R (near the charge, around point )
- Element S (far from the charge, around point )
Both elements are cut by the same set of field lines — the same number of lines passes through each. The cone of lines subtends a solid angle at the charge O. The distances from O to the elements are labelled and . The areas of the elements are and , respectively.
The figure also has two annotations:
- "region of strong field" near the charge (upper-left)
- "region of weak field" far from the charge (upper-right)
Physical Idea Taught
The figure illustrates that the number of field lines crossing any area that subtends a given solid angle is constant, regardless of distance from the charge. Because the same number of lines passes through a smaller area near the charge and a larger area far away, the density of field lines (lines per unit area) is higher near the charge. This density directly indicates the strength of the electric field: where lines are crowded, the field is strong; where they are spread apart, the field is weak.
Thus, the figure provides an intuitive, non-mathematical way to understand why the electric field of a point charge obeys an inverse-square law — the field strength is proportional to the number of lines per unit area, and area grows as , so field strength falls as .
Key Formula Developed
The textbook uses the figure to derive the inverse-square dependence. Let:
- = number of field lines crossing the solid angle (same for both elements)
- = solid angle subtended by each area element at O
- , = distances from O to and
- Area of element at =
- Area of element at =
The number of field lines per unit area (line density) at is: …
Drawn by us to help you understand the concept clearly, and verified to make sure it's accurate. For exams, practice from your NCERT textbook's own diagram.
What the Figure Shows
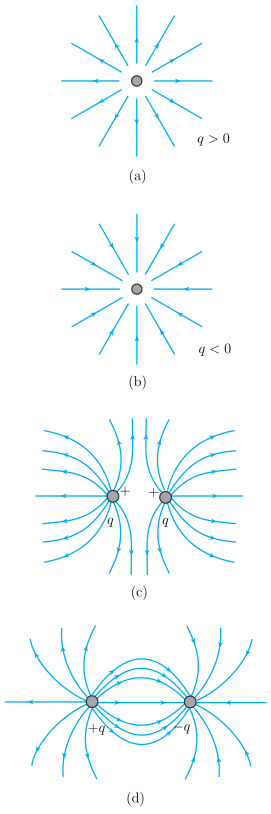
The figure is a vertical column of four panels, each depicting electric field lines for a different charge configuration. The panels are:
- (a) A single positive charge (): Twelve straight lines radiate outward from the charge. Each line has an arrowhead at its midpoint, indicating the direction of the electric field — away from the charge. The lines are evenly spaced, showing radial symmetry.
- (b) A single negative charge (): The same twelve straight lines, but now the arrowheads point inward toward the charge, showing the field direction is toward the charge.
- (c) Two equal positive charges ( and ): Field lines emerge from each charge and curve away from the other charge. In the region midway between the charges, the lines become nearly vertical (perpendicular to the line joining the charges), illustrating mutual repulsion. No lines cross the midpoint horizontally.
- (d) An electric dipole ( and ): Field lines leave the positive charge and curve around to end on the negative charge. Above and below the axis joining the charges, there are nested arcs. In each quadrant, outer sweeps show the field lines bending from to , demonstrating attraction.
Physical Idea Taught
The figure teaches how electric field lines visually encode the direction and relative strength of the electric field. Key concepts:
- Direction: The tangent to a field line at any point gives the direction of the electric field at that point. Arrows on the lines specify the sense (from positive to negative, or outward/inward for isolated charges).
- Strength: The density (closeness) of field lines indicates the magnitude of . Lines are closer where the field is stronger (near charges) and spread apart where it is weaker (far away).
- Properties illustrated:
- Lines start on positive charges and end on negative charges (or go to infinity for isolated charges).
- Lines never cross (unique direction at each point).
- For a dipole, lines form open curves (not closed loops), consistent with the conservative nature of electrostatic fields.
Key Formula Developed with This Figure
The textbook uses the figure to derive the inverse-square law for the electric field of a point charge. Consider a point charge at the origin. At a distance , the electric field magnitude is:
where:
- is the magnitude of the electric field (in N/C or V/m), …