Q.(a) Study the flow chart given below and complete the equation that follows by identifying 1, 2, 3 and 4. Nt + 1 = Nt + {(1 + 2) – (3 + 4)}
🔒You're viewing a preview — the full solution, concept, methods & PYQ mapping are locked.
🔒 Start your 14-day free trial to unlock the full solution →Part (a)Concept understanding — Population Growth Factors
Population Growth Factors: A First Look
Think about a village, a city, or even your own family. Why do some families grow larger over time, while others stay the same size or shrink? Why do some cities burst with new people while others seem to lose residents? The answer lies in population growth factors — the forces that determine whether a population increases, decreases, or stays stable.
The Core Idea
At its simplest, a population changes because of two things: people being added and people being taken away. But what adds people? Only one thing: births. What takes people away? Only one thing: deaths. That is the natural rhythm of any population.
But there is a third force that matters enormously for a country, state, or city: migration. People move in (immigration) and people move out (emigration). So the real equation — though we are not using numbers here — is:
Births + Immigration = Additions
Deaths + Emigration = Subtractions
When additions are greater than subtractions, the population grows. When subtractions are greater, it shrinks. When they are equal, it stays the same.
The Three Main Factors
The NCERT textbook identifies three broad categories of factors that influence these additions and subtractions:
1. Fertility (the birth side)
Fertility is not just about biology — it is deeply shaped by society. Why do people in some regions have many children, while in others they have few? The factors include:
- Age at marriage: Earlier marriage generally means a longer childbearing period.
- Education and employment of women: Educated women who work tend to have fewer children and have them later.
- Economic conditions: In agricultural societies, children are often seen as economic assets (help on the farm). In urban industrial societies, children are more of an expense.
- Cultural and religious norms: Some communities encourage large families; others do not.
- Government policies: Think of China's former one-child policy or India's family planning programmes.
2. Mortality (the death side)
Why do people die earlier in some places than in others? The key factors are:
- Healthcare infrastructure: Access to hospitals, vaccines, and medicines.
- Nutrition and sanitation: Malnutrition and unclean water kill millions.
- Disease patterns: Epidemics like malaria, tuberculosis, or HIV/AIDS.
- Natural disasters and conflicts: Famines, wars, earthquakes.
- Age structure: A population with many elderly people will naturally have more deaths.
The most dramatic change in human history came from a decline in mortality — not a rise in fertility. Better medicine, sanitation, and food supply caused death rates to fall sharply, especially in the 20th century. This is why the world's population exploded.
3. Migration (the movement side)
People move for reasons that pull them towards a place or push them away from another.
Push factors (reasons to leave):
- Unemployment or low wages
- Political instability or persecution
- Natural disasters or environmental degradation
- Lack of educational opportunities
Pull factors (reasons to come):
- Better job prospects and higher incomes
- Peace and security
- Better schools and universities
- Family reunification
Migration can be internal (within a country, like rural-to-urban movement) or international (across borders).
Why This Matters
Population growth factors are not just academic. They shape everything:
- Economic planning: A rapidly growing population needs more schools, hospitals, jobs, and housing. A shrinking population faces labour shortages and an ageing society.
- Resource use: More people mean more demand for water, food, energy, and land. …
Part (b)Concept understanding — Ecological Pyramid
Picture a real pyramid -- wide at the base, narrowing all the way up to a single point at the top. Ecologists borrow exactly this shape to describe something that has nothing to do with stone: how numbers, weight (biomass), or energy are distributed across the feeding levels of a food chain. This visual model is called an ecological pyramid.
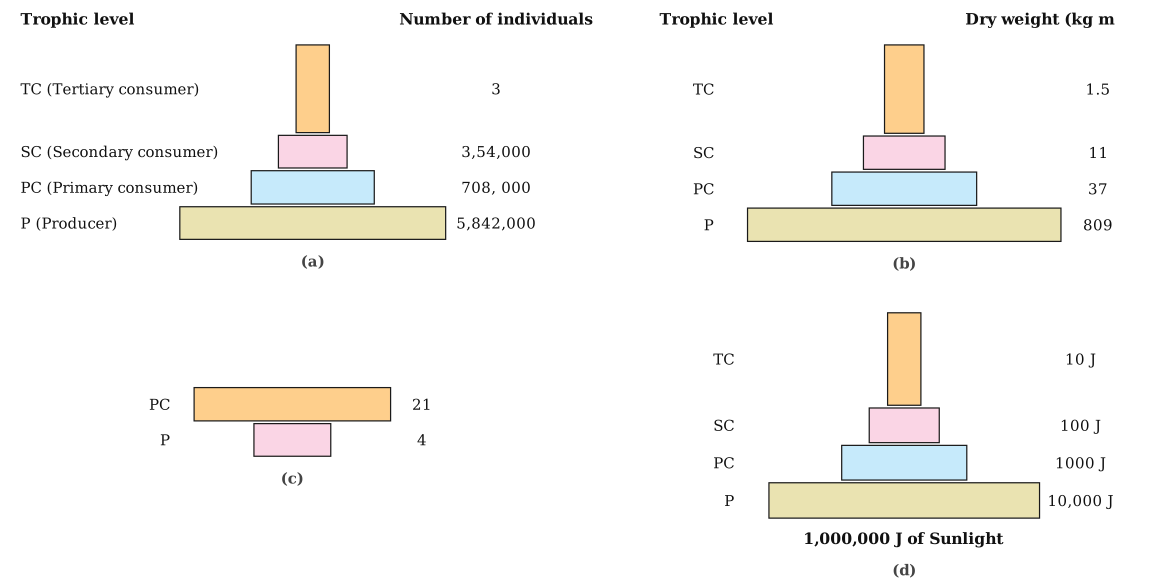
Every ecological pyramid works the same way. In your NCERT textbook (Class 12 Biology, Chapter 12, Ecosystem, section 12.5), the base always represents the producers -- the first trophic level -- and each successive tier above it represents the next trophic level up (herbivores, then primary carnivores, then secondary or top carnivores), with the apex representing the top-level consumer. Three distinct types are studied, because the same food-chain relationship can be measured in three different ways:
- Pyramid of numbers -- plots the count of individual organisms at each trophic level. NCERT's own grassland example is dramatic: nearly 6 million producer plants are needed to support just three top-carnivores at the apex.
- Pyramid of biomass -- plots the standing crop (usually expressed as dry weight, which is more accurate than fresh weight) of organisms at each level, rather than headcount.
- Pyramid of energy -- plots the amount of energy present at each trophic level, measured per unit area, usually annually.
In most ecosystems, all three pyramids come out upright -- producers are more numerous and have more biomass than herbivores, and herbivores more than carnivores -- because energy shrinks at every step up the food chain (the same 10 per cent law behind energy flow: only about 10 per cent of the energy at one trophic level is transferred to the next).
When a pyramid turns upside down -- numbers and biomass pyramids don't always come out upright, and NCERT points to genuine exceptions you're expected to reason through, not just memorise:
- A single large tree can support so many feeding insects that a pyramid of numbers built around it is inverted right at the base -- one producer, many primary consumers.
- The pyramid of biomass in the sea is commonly inverted: at any given moment the standing crop of tiny, fast-reproducing phytoplankton is small, yet it is turning over fast enough to support a much larger standing crop of the zooplankton feeding on it.
The pyramid of energy is the one type that is never inverted -- it is always upright, in every ecosystem, without exception. Energy is lost as heat at every transfer between trophic levels (unlike nutrients, it is never recycled back), so the level below always has to hold more usable energy than the level feeding on it. …
Part (a)
In the equation Nt+1 = Nt + {(1 + 2) - (3 + 4)}:
- 1 = Natality (births) and 2 = Immigration — these add individuals.
- 3 = Mortality (deaths) and 4 = Emigration — these remove individuals. …
- 1 = natality, 2 = immigration, 3 = mortality, 4 = emigration; density is measured by direct counts, percent cover/biomass, or indirect signs (pug marks, pellets, catch per effort).
- The energy pyramid is always upright (energy falls ~10% per level); biomass pyramids are upright on land but inverted in aquatic (pond/sea) ecosystems.
Part (a)
Completing the population equation
A population's size at the next time interval, Nt+1, depends on four processes:
Nt+1 = Nt + {(Natality + Immigration) - (Mortality + Emigration)}
- 1 = Natality (B): the number of births — the chief way most populations grow.
- 2 = Immigration (I): individuals of the same species coming into the habitat.
- 3 = Mortality (D): the number of deaths.
- 4 = Emigration (E): individuals leaving the habitat to settle elsewhere.
Natality and immigration add individuals; mortality and emigration remove them. When (births + immigrants) exceed (deaths + emigrants) the population grows; otherwise it declines or stays steady.
Ways of measuring population density
- Direct/total count: actually counting all individuals (feasible for large, conspicuous species in a small area).
- Percent cover or biomass: for plants, where counting individuals (e.g., grass) is meaningless.
- Indirect estimates (signs of presence): pug marks and fecal pellets are used to census tigers and other mammals. …
Showing the 12 most recent of 24 on this concept.
- CBSE 2026Set 57/3/11 markMCQQ.Every trophic level has a certain mass of living material at a particular time. What is it called ? (A) Standing crop (B) Primary productivity (C) Standing state (D) Ecological efficiency
›Reveal solutionSolution
The mass of living material present at each trophic level at any given moment is called the standing crop.
When ecologists study how energy and matter flow through an ecosystem, they need a way to measure what's actually present at each feeding level at any snapshot in time. Imagine walking into a grassland and asking: how much grass is there right now? How many grasshoppers? How many birds feeding on those grasshoppers? Each of these groups represents a trophic level, and the total mass of all organisms at that level, measured at a particular moment, has a specific name.
This measurement is called the standing crop. It represents the biomass—the total dry weight of all living organisms—at a given trophic level at a specific point in time. Think of it as taking inventory of life: if you could weigh all the producers, or all the primary consumers, or all the secondary consumers in an ecosystem right now, that weight would be the standing crop for that level.
The standing crop is crucial because it forms the basis of ecological pyramids. When we draw a pyramid of biomass, each bar represents the standing crop at that trophic level. In most terrestrial ecosystems, you'll see a classic pyramid shape—lots of plant biomass at the base, less herbivore biomass in the middle, and even less carnivore biomass at the top. But in some aquatic ecosystems, the pyramid can be inverted because phytoplankton (though small in total mass at any moment) reproduce so rapidly that they can support a larger standing crop of zooplankton. …
- CBSE 2026Set BOTANY1 markMCQQ.In an ecological pyramid of energy, _____ trophic level is occupied by the herbivores.(a) first(b) second(c) third(d) fourth
›Reveal solutionSolution
In any ecological pyramid (of energy, numbers, or biomass), producers occupy the first trophic level and herbivores (primary consumers) occupy the second.
An ecological pyramid represents the trophic structure of an ecosystem as successive trophic levels, arranged from producers at the base upward through consumers. The general sequence is:
- First trophic level - producers (green plants/algae), which fix solar energy through photosynthesis.
- Second trophic level - primary consumers, i.e. herbivores, which feed directly on producers (e.g. a grasshopper eating grass, or zooplankton eating phytoplankton).
- Third trophic level - secondary consumers (primary carnivores), which eat herbivores.
- Fourth trophic level - tertiary consumers (secondary/top carnivores), which eat other carnivores. …
- CBSE 2026Set ANNUAL1 markMCQQ.Pyramid of biomass in the sea are generally(a) Straight(b) Upright(c) Invert(d) All kinds
›Reveal solutionSolution
Unlike a pond or forest, the biomass pyramid in the sea is typically inverted because the producers (phytoplankton) have very small standing biomass but a very high turnover/reproduction rate.
In a marine ecosystem, producer biomass at any instant (phytoplankton) is small, since they are rapidly consumed and have short life spans and fast reproduction, while the standing biomass of consumers (zooplankton, fish etc.) at higher trophic levels is comparatively larger. So when biomass is plo …
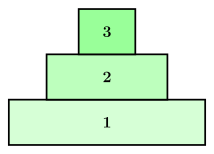
- CBSE 2026Set ANNUAL1 markMCQQ.The diagram given below shows the type of an ecological pyramid. A sharp decrease is seen at higher trophic levels. Choose the correct option for the indication of this pyramid.(a) The energy is increasing at higher trophic level(b) The energy is same in all trophic levels(c) The energy is constant in all trophic levels(d) The energy is decreasing at higher trophic level
›Reveal solutionSolution
Energy decreases progressively at each successive trophic level because a large fraction (~90%) is lost as heat/respiration at every transfer (the 10% law), so the pyramid of energy is always upright and each tier is smaller than the one below it.
At each trophic level, organisms use most of the energy they receive for their own respiration, movement and metabolism, and only a small fraction (roughly 10%, per Lindeman's 10% law) is stored in biomass and passed on to the next trophic level when consumed. This progressive energy loss means producers (tier 1, widest base) always have the most energy, prim …
- CBSE 2026Set ANNUAL1 markMCQQ.Assertion : The pyramid of energy is always upright. Reason : At each trophic level some energy is lost as heat.(a) If both Assertion and Reason are true and Reason is a correct explanation of the Assertion.(b) If both Assertion and Reason are true but Reason is not a correct explanation of the Assertion.(c) If Assertion is true but Reason is false.(d) If both Assertion and Reason are false.
›Reveal solutionSolution
Both statements are true and the loss of energy as heat at each trophic level is exactly why the energy pyramid is always upright — so the answer is (A).
Assertion: The pyramid of energy is always upright — TRUE. Unlike pyramids of number or biomass (which can be inverted), the energy pyramid can never be inverted.
Reason: At each trophic level some energy is lost as heat — TRUE. As energy flows from one trophic level to the next, only about 10% is transferred; the rest is lost mainly as heat during respiration and metabolism (Lindeman's 10% law).
…
- CBSE 2025Set X11 markMCQQ.Select the one among the given that is a probable reason for explosive growth of population in India.(a) A rapid increase in MMR(b) A rapid increase in IMR(c) Increase in the number of people in reproducible age(d) A rapid increase in death rate
›Reveal solutionSolution
The explosive population growth in India is largely due to a rise in the number of people in the reproducible (reproductive) age group.
A decline in maternal mortality rate (MMR) and infant mortality rate (IMR), plus an increase in the number of people reaching reproductive age, are the main reasons for the rapid rise in India's population. Among the given options, an increase in the number of people in the reproducible age directly increases the birth rat …
- CBSE 2025Set ANNUAL1 markMCQQ.The pyramid of energy is-(a) Always inverted(b) Always upright(c) Some times uprighted and some time inverted(d) None of these
›Reveal solutionSolution
The pyramid of energy is always upright because energy loss occurs at every trophic level.
As per the second law of thermodynamics, energy flow through an ecosystem is unidirectional and a substantial part of the energy is always lost as heat (through respiration) at every trophic transfer. Because of this progressive loss, the amount of energy available decreases from producers to successive consumer levels. Hence, when energy content is plotted against trophic level, the pyramid of energy always ha …
- CBSE 2025Set ANNUAL1 markQ.The pyramid of _________ is always upright and can never be inverted.
›Reveal solutionSolution
Because energy is progressively lost as heat at each trophic transfer, the pyramid of energy can never be inverted; it is always upright, unlike pyramids of numbers or biomass in some ecosystems.
Ecological pyramids can be of three types: pyramid of number, pyramid of biomass, and pyramid of energy.
- Pyramids of number and biomass may sometimes be inverted (e.g., a pyramid of numbers is inverted in a tree ecosystem where one tree supports many insects; a pyramid of biomass is inverted in a pond/sea ecosystem where a small standing crop of phytoplankton supports a larger biomass of zooplankton and fish). …
- CBSE 2025Set ANNUAL1 markMCQQ.An inverted pyramid of biomass can be found in(a) deserts(b) marine(c) grassland(d) tundra
›Reveal solutionSolution
Marine ecosystems commonly show an inverted biomass pyramid, since the standing crop of tiny, fast-reproducing phytoplankton is much smaller than the biomass of the zooplankton and fish that depend on it.
A pyramid of biomass represents the total mass of living organisms at each trophic level. It is usually upright in most terrestrial ecosystems (like deserts, grasslands, and tundra), since producer biomass exceeds that of the consumers feeding on it. However, in marine (e.g., open ocean) ecosystems, the producers (phytoplankton) have a very small standing biomass at any given time (because they are tiny, short-lived, and reproduce rapidly, being continuously consumed and replac …
- CBSE 2025Set ANNUAL1 markMCQQ.The most effective way to decrease the population of a country is :(a) to educate people(b) to have better houses and infrastructure(c) to eradicate poverty(d) to practice and implement family planning
›Reveal solutionSolution
Practising and implementing family planning (contraception, spacing, small family norm) is the most direct and effective lever to reduce population growth rate.
While education, better infrastructure and poverty eradication all indirectly influence fertility rates over long timeframes by changing social attitudes, the most direct and immediately effective method to reduce population growth is the active practice and implementation of family planning — the use of contraceptive methods (natural, barrier, IUDs, oral pills, surgical methods like vasectomy/tubectomy) to control the number and spacing of children, alongside government promotio …
- CBSE 2024Set 57/2/11 markMCQQ.The pyramid of biomass in sea is generally inverted because in sea : (A) Biomass of fishes exceeds that of phytoplankton. (B) Number of phytoplanktons is more. (C) Number of phytoplanktons is less. (D) Large fishes feed on small fishes.
›Reveal solutionSolution
The pyramid of biomass in the sea is inverted because the standing crop (biomass at any given moment) of phytoplankton is smaller than that of zooplankton and fish, even though phytoplankton reproduce rapidly and support the entire food chain.
An ecological pyramid is a graphical representation that shows the relationship between different trophic levels in an ecosystem. When we talk about a pyramid of biomass, we're measuring the total dry weight of all living organisms at each level at a particular moment in time — what ecologists call the "standing crop."
In most terrestrial ecosystems, the pyramid of biomass is upright. Think of a forest: the biomass of trees (producers) far exceeds that of herbivores, which in turn exceeds that of carnivores. This makes intuitive sense — you need a large base of producers to support the levels above.
But marine ecosystems, particularly the open ocean, present a fascinating exception. Here the pyramid of biomass is typically inverted, meaning the biomass of producers is actually less than that of consumers at higher trophic levels. This seems to violate basic ecological logic — how can a smaller base support a larger structure?
The answer lies in the nature of phytoplankton, the primary producers of marine ecosystems. These microscopic organisms have an extraordinarily high rate of reproduction and turnover. A single phytoplankton cell might live only a few days, but during that time it reproduces rapidly. So while the standing biomass of phytoplankton at any given moment is small, their productivity — the rate at which they produce new biomass — is enormous.
NoteThink of it like a busy restaurant with a small kitchen but very fast service. At any moment there aren't many dishes ready (small standing crop), but over the course of a day, hundreds of meals are produced (high productivity). …
- CBSE 2024Set E1 markMCQQ.What is the population growth rate of India as per 2001 census?(a) 1.1%(b) 3.7%(c) Approximately 2%(d) 3%
›Reveal solutionSolution
India's population growth rate at the 2001 census was approximately 2%.
The alarming rise in India's population was a major reason for adopting family planning and reproductive-health programmes. Around the 2000–2001 census, the population growth rate was still high — approximately 2% (about 20 per 1000 people per year) — meaning the population could nearly double in a short span. This high growth r …
🎓Unlock everything free for 14 days
- ✓Full step-by-step solutions
- ✓Concept-first explanations
- ✓Methods, shortcuts & mistakes
- ✓PYQ mapping + timed mock tests
Full access for 14 days. No credit card required.