Q.(a)
🔒You're viewing a preview — the full solution, concept, methods & PYQ mapping are locked.
🔒 Start your 14-day free trial to unlock the full solution →Part (a)Concept understanding — Population Growth Factors
Population Growth Factors: A First Look
Think about a village, a city, or even your own family. Why do some families grow larger over time, while others stay the same size or shrink? Why do some cities burst with new people while others seem to lose residents? The answer lies in population growth factors — the forces that determine whether a population increases, decreases, or stays stable.
The Core Idea
At its simplest, a population changes because of two things: people being added and people being taken away. But what adds people? Only one thing: births. What takes people away? Only one thing: deaths. That is the natural rhythm of any population.
But there is a third force that matters enormously for a country, state, or city: migration. People move in (immigration) and people move out (emigration). So the real equation — though we are not using numbers here — is:
Births + Immigration = Additions
Deaths + Emigration = Subtractions
When additions are greater than subtractions, the population grows. When subtractions are greater, it shrinks. When they are equal, it stays the same.
The Three Main Factors
The NCERT textbook identifies three broad categories of factors that influence these additions and subtractions:
1. Fertility (the birth side)
Fertility is not just about biology — it is deeply shaped by society. Why do people in some regions have many children, while in others they have few? The factors include:
- Age at marriage: Earlier marriage generally means a longer childbearing period.
- Education and employment of women: Educated women who work tend to have fewer children and have them later.
- Economic conditions: In agricultural societies, children are often seen as economic assets (help on the farm). In urban industrial societies, children are more of an expense.
- Cultural and religious norms: Some communities encourage large families; others do not.
- Government policies: Think of China's former one-child policy or India's family planning programmes.
2. Mortality (the death side)
Why do people die earlier in some places than in others? The key factors are:
- Healthcare infrastructure: Access to hospitals, vaccines, and medicines.
- Nutrition and sanitation: Malnutrition and unclean water kill millions.
- Disease patterns: Epidemics like malaria, tuberculosis, or HIV/AIDS.
- Natural disasters and conflicts: Famines, wars, earthquakes.
- Age structure: A population with many elderly people will naturally have more deaths.
The most dramatic change in human history came from a decline in mortality — not a rise in fertility. Better medicine, sanitation, and food supply caused death rates to fall sharply, especially in the 20th century. This is why the world's population exploded.
3. Migration (the movement side)
People move for reasons that pull them towards a place or push them away from another.
Push factors (reasons to leave):
- Unemployment or low wages
- Political instability or persecution
- Natural disasters or environmental degradation
- Lack of educational opportunities
Pull factors (reasons to come):
- Better job prospects and higher incomes
- Peace and security
- Better schools and universities
- Family reunification
Migration can be internal (within a country, like rural-to-urban movement) or international (across borders).
Why This Matters
Population growth factors are not just academic. They shape everything:
- Economic planning: A rapidly growing population needs more schools, hospitals, jobs, and housing. A shrinking population faces labour shortages and an ageing society.
- Resource use: More people mean more demand for water, food, energy, and land. …
Part (b)Concept understanding — Species Area Relationship
The Species Area Relationship: A First Look
Imagine you are walking through a small park near your home. You might spot a few birds, some insects, and a handful of plant species. Now imagine that same walk through a large forest reserve — hundreds of times bigger. Would you expect to see more kinds of birds, more types of insects, more varieties of trees? Almost certainly yes. That simple, intuitive observation is the seed of the Species Area Relationship.
What It Means
The Species Area Relationship (often abbreviated as SAR) is a pattern ecologists have observed across the natural world: as the area you sample increases, the number of species you find also increases. It is not a vague guess — it is a consistent, well-documented relationship that holds true for most groups of organisms, from plants and birds to insects and mammals.
Why does this happen? A larger area typically contains more habitats — forests, grasslands, wetlands, rocky outcrops — and each habitat supports its own set of species. A bigger area also tends to have more individuals, and with more individuals you are more likely to encounter rare species that might be absent from a small patch. In short, area acts as a rough proxy for ecological diversity and complexity.
Key Points to Remember
- The relationship is positive: bigger area → more species.
- It is not linear — doubling the area does not double the number of species. The increase slows down as area gets very large.
- The pattern holds across scales: from a single leaf (hosting tiny insects and fungi) to an entire continent.
The NCERT textbook for Class 12 Biology (Chapter 15, Biodiversity and Conservation) introduces this concept in the context of biodiversity patterns. It states that the relationship between species richness and area is described by a curve that rises rapidly at first and then flattens. The textbook does not require you to memorise any equation — only to understand the general trend and its implications.
Why It Matters
The Species Area Relationship is not just an academic curiosity. It has real-world consequences, especially for conservation.
- Designing protected areas: If you want to preserve a certain number of species, you need to know how much area is required. A small reserve may protect only a fraction of the region's biodiversity.
- Predicting extinctions: When a habitat is destroyed or fragmented, the remaining area shrinks. Using the SAR, ecologists can estimate how many species are likely to be lost as a result.
- Understanding island biology: The relationship was first studied on islands, where area is clearly defined and isolation limits immigration. The same logic applies to "habitat islands" — patches of forest surrounded by farmland, or national parks surrounded by cities. …
Part (a)
(i) With limited resources a population shows logistic growth: slow initial (lag) growth, then rapid (exponential) growth, which slows as resources become limiting, until the population stabilises at the carrying capacity (K) of the habitat.
(ii) Equation: dN/dt = rN[(K - N)/K], where N = population size, r = intrinsic rate of natural increase, K = carrying capacity. …
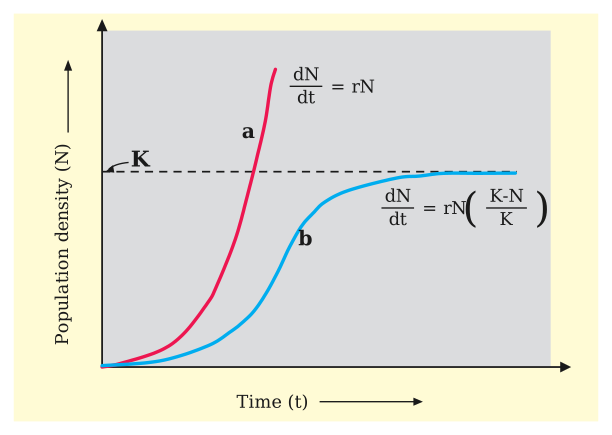
Part (a): A population with limited resources follows the logistic (sigmoid) growth curve, dN/dt = rN[(K-N)/K], levelling off at the carrying capacity K.
Part (b): The species-area relationship shows species richness rising with area (a hyperbola, straight on a log-log plot) described by log S = log C + Z log A.
Part (a)
(i) The growth curve under limited resources
No natural habitat has unlimited resources, so a population cannot grow exponentially for long. Growth follows a logistic pattern:
- a slow initial lag phase,
- a phase of rapid (acceleration/exponential) growth,
- deceleration as resources (food, space) become limiting and competition rises,
- stabilisation around the carrying capacity (K) — the maximum number the habitat can support.
(ii) Equation
dN/dt = rN[(K − N)/K]
where N = population size at time t, r = intrinsic rate of natural increase, and K = carrying capacity. When N is small, (K-N)/K is near 1 and growth is almost exponential; as N approaches K the term approaches 0 and growth stops.
(iii) Name and graph
This is the logistic growth curve (Verhulst-Pearl logistic curve), giving a sigmoid / S-shaped plot:
N |            ________ K (carrying capacity)
  |          /
  |        /
  |      /
  |____/________________ time (t) …
- CBSE 2025Set X11 markMCQQ.Select the one among the given that is a probable reason for explosive growth of population in India.(a) A rapid increase in MMR(b) A rapid increase in IMR(c) Increase in the number of people in reproducible age(d) A rapid increase in death rate
›Reveal solutionSolution
The explosive population growth in India is largely due to a rise in the number of people in the reproducible (reproductive) age group.
A decline in maternal mortality rate (MMR) and infant mortality rate (IMR), plus an increase in the number of people reaching reproductive age, are the main reasons for the rapid rise in India's population. Among the given options, an increase in the number of people in the reproducible age directly increases the birth rat …
- CBSE 2025Set ANNUAL1 markMCQQ.The relation between species richness and area for a wide variety of taxa on a logarithmic scale is a(a) Rectangular hyperbola(b) Straight line(c) Sigmoid curve(d) Sine curve
›Reveal solutionSolution
On a log-log plot, species richness rises linearly with area (log S = log C + Z log A); on a normal (non-log) scale it is a rectangular hyperbola.
Ecologists have found that, within a region, species richness (S) increases with explored area (A), but only up to a certain limit; beyond this, the addition of new species with increasing area is minimal. On a normal (arithmetic) scale, this species-area relationship for a wide variety of taxa (plants, birds, fish) turns out to be a curve — specifically, a rectangular hyperbola.
…
- CBSE 2025Set ANNUAL1 markMCQQ.The most effective way to decrease the population of a country is :(a) to educate people(b) to have better houses and infrastructure(c) to eradicate poverty(d) to practice and implement family planning
›Reveal solutionSolution
Practising and implementing family planning (contraception, spacing, small family norm) is the most direct and effective lever to reduce population growth rate.
While education, better infrastructure and poverty eradication all indirectly influence fertility rates over long timeframes by changing social attitudes, the most direct and immediately effective method to reduce population growth is the active practice and implementation of family planning — the use of contraceptive methods (natural, barrier, IUDs, oral pills, surgical methods like vasectomy/tubectomy) to control the number and spacing of children, alongside government promotio …
- CBSE 2024Set E1 markMCQQ.What is the population growth rate of India as per 2001 census?(a) 1.1%(b) 3.7%(c) Approximately 2%(d) 3%
›Reveal solutionSolution
India's population growth rate at the 2001 census was approximately 2%.
The alarming rise in India's population was a major reason for adopting family planning and reproductive-health programmes. Around the 2000–2001 census, the population growth rate was still high — approximately 2% (about 20 per 1000 people per year) — meaning the population could nearly double in a short span. This high growth r …
- CBSE 2024Set ANNUAL1 markMCQQ.Observe the graph and select correct option (species richness vs. area, log-log scale, two curves A and B):(a) Line 'A' represents S = CA²(b) Line 'B' represents log C = log A + Z log S(c) Line A represents S = CA^Z(d) Line B represents log S = log Z + C log A
›Reveal solutionSolution
On a log-log plot, the species-area relationship follows the power law S = C·A^Z, which appears as a straight line; the plain (non-log) curve rises steeply then plateaus.
The species-area relationship describes how species richness (S) increases with sampled area (A) according to S = C·A^Z, where C is a constant (species density) and Z is the slope reflecting the rate of increase (regression coefficient). When plotted on ordinary axes, this relationship appears as a curve that rises steeply and then flattens (a rectangular-hyperbola-like shape) — matching curve A in the figure. When the same relationship is plotted on a log-log scale, taking logarithms of both sides gives l …
- CBSE 2023Set 57/1/11 markMCQQ.The status of the human population reflected in the human age pyramid given below is :(a) Declining population(b) Stable population(c) Expanding population(d) Extinct population
›Reveal solutionSolution
An age pyramid's shape reveals population growth trend: a broad base tapering upward means high birth rates and growth; roughly equal widths mean a stable population; a narrow base with a wider middle/top means decline.
Understanding Age Pyramids
An age pyramid is a graphical representation showing the distribution of a population across different age groups, typically divided by sex. The shape of this pyramid indicates whether a population is growing, stable, or shrinking.
The key lies in the base of the pyramid. A population's future depends on how many individuals are in, or approaching, reproductive age. When the base is wide, a large number of births are occurring relative to older age groups — this population has momentum to grow.
Reading the Pyramid Shape
Expanding (growing) population: the pyramid has a broad base that tapers steadily toward the top, reflecting high birth rates, with each younger age group larger than the one above it.
Stable population: the pyramid resembles a column or bell, with roughly equal proportions across reproductive age groups — birth rates approximately equal death rates.
Declining population: the pyramid is narrow at the base and wider in the middle or upper sections — fewer children are being born than there are adults, and the population will shrink as older generations are not replaced.
Extinct population: this would show virtually no individuals in younger age groups — a theoretical extreme, not a shape a real census pyramid shows.
Applying this to the pyramid in the question
- Look at the base first — is it the widest part of the pyramid?
- Check the progression — does each age group get progressively smaller moving up? …
- CBSE 2021Set TERM11 markMCQQ.IMR stands for :(a) Infant Mortality Rate(b) Intact Mortality Rate(c) Instant Mortality Rate(d) Infact Mortality Rate
›Reveal solutionSolution
IMR is a standard demographic/health statistic used to gauge maternal-and-child health and healthcare quality in a population.
IMR (Infant Mortality Rate) measures the number of deaths of infants under one year of age per 1,000 live births in a year. It is widely used, alongside the Maternal Mortality Rate (MMR) and Sex Ratio, as an indicator of a population's reproductive and general health status, and of the quality/reach of healthcare servi …
- CBSE 2017Set ANNUAL1 markMCQQ.Z-values of a frugivorous bat species are given below. Which value is not applicable to continents ?(a) 0.6(b) 0.65(c) 0.20(d) 0.68
›Reveal solutionSolution
In the species-area relationship (log S = log C + Z log A), Z is usually 0.1-0.2 for small/regional areas but rises to about 0.6-1.2 when entire continents are compared, so 0.20 does not fit the continental range.
The naturalist Alexander von Humboldt found that within a region, species richness increases with explored area, but only up to a limit. On a log-log plot this relationship is a straight line described by log S = log C + Z log A, where S = species richness, A = area, Z = slope (regression coefficient) and C = the intercept.
Regardless of the taxonomic group or the region studied, the value of Z is remarkably consistent, falling in the narrow range of 0.1 to 0.2, when the analysis is confined to smaller, comparable areas within a region.
…
🎓Unlock everything free for 14 days
- ✓Full step-by-step solutions
- ✓Concept-first explanations
- ✓Methods, shortcuts & mistakes
- ✓PYQ mapping + timed mock tests
Full access for 14 days. No credit card required.