Chemistry · Ch 5 — Electrochemistry
Variation of molar conductivity with concentration
Variation of molar conductivity with concentration
The variation of molar conductivity with concentration is qualitatively different for strong and weak electrolytes.
i. Strong electrolytes : The molar conductivity of a solution of a strong electrolyte increases rapidly with dilution. It approaches a limiting value for a 0.001 M or 0.0001 M solution; thereafter dilution has no effect on the molar conductivity. This maximum limiting value is the molar conductivity at zero concentration (or at infinite dilution), denoted by . "Zero concentration" or "infinite dilution" means the solution is so dilute that further dilution does not increase the molar conductivity.
During the nineteenth century F. Kohlrausch showed, with repeated experiments, that the molar conductivity of strong electrolytes varies linearly with the square root of concentration:
where is a constant. For strong electrolytes, a plot of versus is linear, as shown in Fig. 5.1.
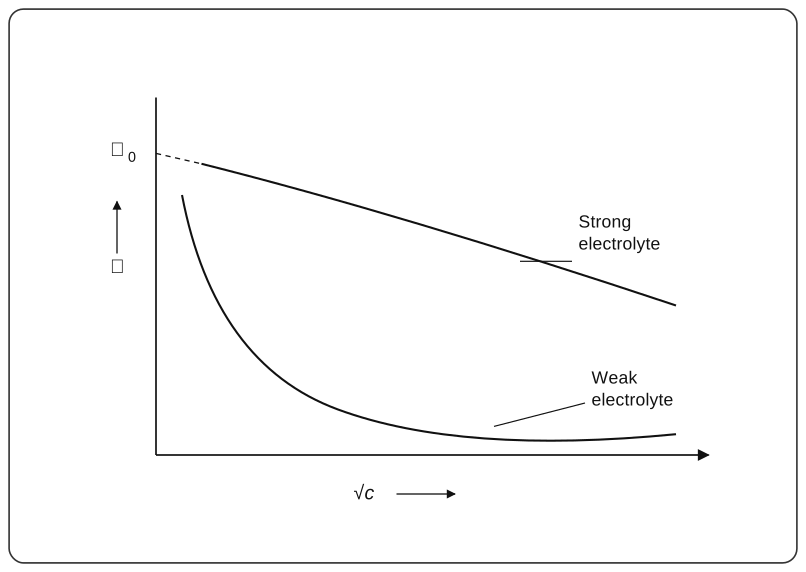
Drawn by us to help you understand the concept clearly, and verified to make sure it's accurate. For exams, practice from your textbook's own diagram.
What this figure shows. Molar conductivity (the book's wedge symbol, our ) on the y-axis against on the x-axis, with no numeric ticks. The upper, near-linear curve — labelled Strong electrolyte — falls gently and extrapolates (dashed guide line) to the intercept marked ∧₀ on the y-axis: this extrapolation is how of a strong electrolyte is measured. The lower curve — labelled Weak electrolyte — rises steeply only at extreme dilution (leftmost part) and stays well below at ordinary concentrations; because it never becomes linear, the extrapol …
The molar conductivity of a strong electrolyte at zero concentration is determined by extrapolating the linear part of the versus curve, as shown in Fig. 5.1. …