Q.Explain with diagram the boiling point elevation in terms of vapour pressure lowering.
You're viewing a preview — the full solution, concept, methods & PYQ mapping are locked.
Start your 14-day free trial to unlock the full solution →The solution's vapour-pressure curve lies below the pure solvent's at every temperature, so it reaches the 760 mm boiling line only at a higher temperature — that horizontal gap IS the boiling point elevation (Fig. 2.6).
Step 1. A liquid boils at the temperature where its vapour pressure equals the applied (atmospheric, 760 mm) pressure.
Step 2. Dissolving a nonvolatile solute lowers the solvent's vapour pressure at EVERY temperature ( always), so on a vapour-pressure-vs-temperature plot the solution's curve (CD in Fig. 2.6) lies entirely below the pure solvent's curve (AB).
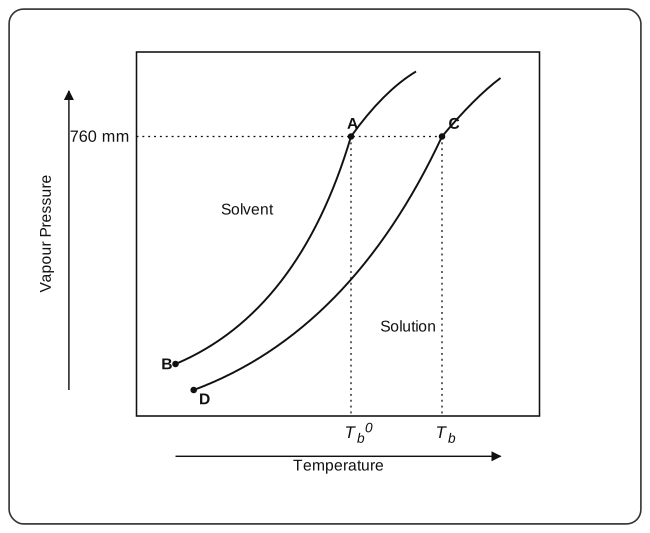
Step 3. Reading horizontally at the 760 mm line: the solvent's curve reaches 760 mm at temperature (its normal boiling point). Because the solution's curve is lower everywhere, it only reaches the SAME 760 mm line at a HIGHER temperature, . …
Unlock everything free for 14 days
- Full step-by-step solutions
- Concept-first explanations
- Methods, shortcuts & mistakes
- PYQ mapping + timed mock tests
Full access for 14 days. No credit card required.