Physics · Ch 13 — AC Circuits
Sharpness of Resonance: Q Factor
Sharpness of Resonance: Q Factor
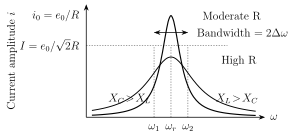
Even away from a series LCR circuit's precise resonant frequency , the current amplitude does not fall to zero immediately -- for a given resistance R, it decreases only gradually as moves away from on either side. To quantify exactly HOW sharply peaked (how frequency-selective) a given resonance curve is, we identify the two 'half-power' frequencies -- the two values of , one above and one below , at which the current amplitude falls to times its own peak (resonant) value; since power is proportional to the square of current amplitude, current falling to of its peak corresponds to POWER falling to exactly HALF its peak value, which is why these are called the half-power frequencies.
Calling these two frequencies (above resonance) and (below resonance) -- symmetric about -- the difference is called the BANDWIDTH of the circuit: a circuit whose current stays close to its maximum over only a very narrow range of around has a small bandwidth and is described as sharply resonant / highly selective, while a circuit whose current falls off only gradually over a wide range has a large bandwidth and is less selective. …
Drawn by us to help you understand the concept clearly, and verified to make sure it's accurate. For exams, practice from your textbook's own diagram.
What this figure shows. A close-up view of the peak region of the series resonance curve (current vs angular frequency ), now explicitly marking the resonant peak at together with two additional points on either side of the peak, at (to the right/higher-frequency side) and (to the left/lower-frequency side), drawn at the height on the curve corresponding to times the peak current value -- with a horizontal dashed line at this height connecting the two marked points, and the horizontal gap between and (the bandwidth ) explicitly marked. The figure also conveys that the lower-frequency flank of the curve is dominated by the capacitor's reactance while the higher-fr …