Physics · Ch 4 — Thermodynamics
The p-V Diagram
The p-V Diagram
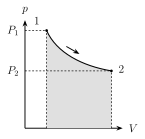
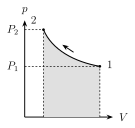
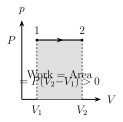
Recall the work-done integral from Section 4.5, (Eq. 4.2). This integral can only be evaluated once the specific relationship between and — that is, the path — connecting the initial and final volumes is known. Graphically, this integral is exactly the area under the p-V curve between the initial and final volumes — so the area under any segment of a p-V curve directly represents the work done by the gas during that segment of the process.
A gas confined to a cylinder with a movable, frictionless, massless piston can change its volume in several distinct ways, each producing a visually distinct p-V curve:
- Expansion with varying pressure — the piston moves outward while the pressure changes continuously along the way; the curve slopes downward as volume rises, and the area beneath it is positive (the gas does positive work).
- Compression with varying pressure — the piston moves inward while the pressure changes continuously; the curve traces from a larger to a smaller volume, and the corresponding work is negative (work is done ON the gas).
- Expansion at constant pressure — the p-V curve is simply a horizontal straight line (parallel to the volume axis) running from an initial volume to a larger final volume ; the rectangular area beneath this flat line gives directly, since here — and only here — the pressure can be pulled outside the integral in Eq. (4.2). …
Drawn by us to help you understand the concept clearly, and verified to make sure it's accurate. For exams, practice from your textbook's own diagram.
What this p-V diagram shows. The graph plots pressure p (vertical axis) against volume V (horizontal axis); the area under the curve equals the work done during the process, and the shape of the path tells you how pressure and volume change tog …
Drawn by us to help you understand the concept clearly, and verified to make sure it's accurate. For exams, practice from your textbook's own diagram.
What this p-V diagram shows. The graph plots pressure p (vertical axis) against volume V (horizontal axis); the area under the curve equals the work done during the process, and the shape of the path tells you how pressure and volume change tog …
Drawn by us to help you understand the concept clearly, and verified to make sure it's accurate. For exams, practice from your textbook's own diagram.
What this p-V diagram shows. The graph plots pressure p (vertical axis) against volume V (horizontal axis); the area under the curve equals the work done during the process, and the shape of the path tells you how pressure and volume change tog …