Business Mathematics and Basic Statistics · Ch 6 — Graphical Representation of Statistical Data
Bar Diagram (Simple and Multiple Bar Diagrams)
Bar Diagram (Simple and Multiple Bar Diagrams)
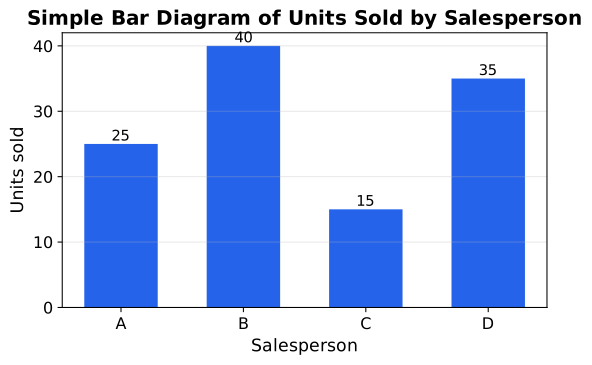
A bar diagram represents categorical or discrete data using rectangular bars of equal width, drawn either vertically or horizontally, with the length (or height) of each bar proportional to the value it represents. Unlike a line graph, the bars are not joined — each bar stands on its own, separated by equal gaps, because bar diagrams are typically used for data that does not naturally flow from one category into the next (products, branches, regions, or years treated as discrete labels rather than a continuous time axis).
Simple Bar Diagram
Equal-width bars, one per category, with height/length directly proportional to the value of that category. All bars start from the same baseline (usually zero) so that heights can be compared fairly by eye.
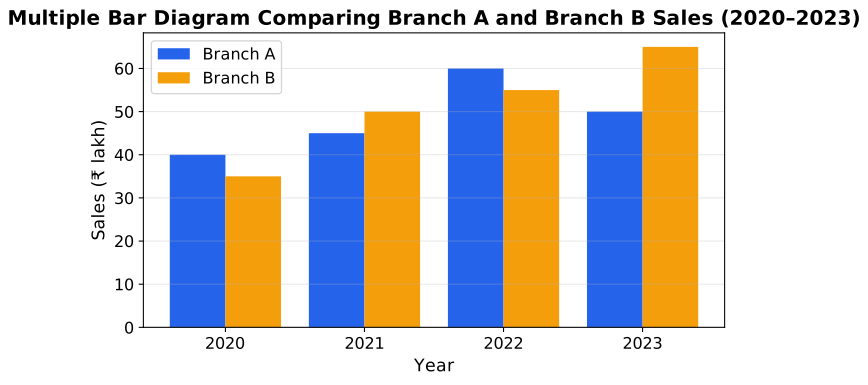
When two or more related quantities need to be compared for the same set of categories (for example, two branches' sales across the same years, or male and female enrolment across the same classes), a multiple bar diagram (also called a grouped or compound bar diagram) places two or more bars side by side within each category, usually shaded or coloured differently with a legend.
Multiple Bar Diagram
For each category, two or more bars — one per data series being compared — are drawn touching each other (no gap between the bars of the same category), with a small gap left between one category's group of bars and the next. This lets a reader compare the series both within a category (bar-to-bar) and across categories (group-to-group) on a single diagram.
A chart representing categorical/discrete data using equal-width bars, one per category, with height proportional to the value, all starting fr …
A bar diagram in which two or more bars, representing different data series, are drawn touching each other within each category, with a gap between the groups of different categories — used to compare several related …