Business Mathematics and Basic Statistics · Ch 6 — Graphical Representation of Statistical Data
Frequency Polygon
Frequency Polygon
A frequency polygon is a line-graph representation of a grouped frequency distribution: instead of rectangles, the midpoint (class mark) of each class is plotted against its frequency, and consecutive points are joined by straight line segments — turning the 'staircase' shape of a histogram into a smooth-looking many-sided figure (hence 'polygon').
Constructing a Frequency Polygon
- Compute the class mark (midpoint) of every class interval.
- Plot each class mark against its frequency.
- Join the plotted points with straight line segments.
- Close the polygon to the X-axis at both ends by extending it to the midpoints of one imaginary class immediately before the first class and one immediately after the last class — each assumed to have zero frequency. This is what turns the line into a genuine closed polygon sitting on the X-axis, rather than a line that appears to float above it.
A frequency polygon can be drawn in either of two ways that always give the identical shape: directly from the class marks and frequencies, as a stand-alone chart, or on top of an already-drawn histogram, by joining the midpoints of the tops of the histogram's rectangles (and then extending to the axis at both ends exactly as above). Drawing it over the histogram is especially useful when the two are meant to be compared on the same axes.
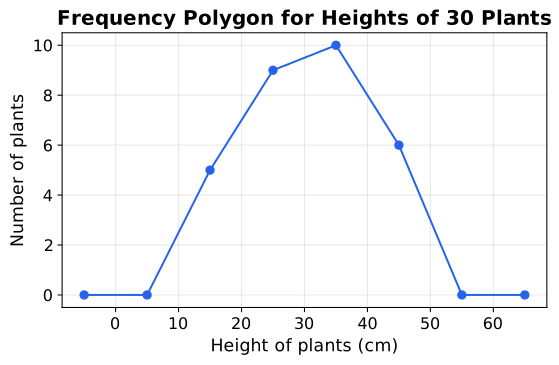
A line graph of a grouped frequency distribution obtained by plotting each class mark against its frequency, joining consecutive points, and closing the figure to the X-axis at both ends using the midpoints of …
The representative value of a class interval, taken as the average of its lower and upper limits: (lower + upper) / 2; the X-value plotted for each po …