Q.What is an adsorption isotherm? Describe Freundlich adsorption isotherm.
🔒You're viewing a preview — the full solution, concept, methods & PYQ mapping are locked.
🔒 Start your 14-day free trial to unlock the full solution →Concept understanding — Freundlich Adsorption Isotherm
Freundlich Adsorption Isotherm
Imagine you have a jar of charcoal and you pump in some gas. Some of that gas sticks to the surface of the charcoal — that's adsorption. The question is: if you increase the pressure of the gas, how much more gas will stick? Does it keep increasing forever, or does it slow down?
That's exactly what the Freundlich isotherm describes.
The Intuition
At very low pressures, there's plenty of empty surface area. So if you double the pressure, roughly twice as many gas molecules hit the surface and stick — adsorption increases almost proportionally. But as pressure rises, the surface starts getting crowded. Now doubling the pressure doesn't double the adsorption, because many spots are already taken. The increase slows down.
So the relationship is not a straight line. It's a curve that rises steeply at first, then flattens out — but never quite reaches a perfect flat ceiling (unlike the Langmuir isotherm, which does).
The Empirical Relation
Freundlich proposed a simple equation that captures this behaviour:
mx=kP1/n
Where:
- x = mass of the gas adsorbed
- m = mass of the adsorbent (the solid)
- mx = amount adsorbed per unit mass of adsorbent
- P = equilibrium pressure of the gas
- k and n are constants that depend on the adsorbent, the gas, and the temperature
The constant n is always greater than 1. This is crucial — it's what makes the curve bend.
What the Constants Mean
k tells you about the capacity of the adsorbent — a larger k means more adsorption at a given pressure. n tells you about the intensity or favourability of adsorption. When n is large (say 3 or 4), the curve flattens quickly — adsorption is strong at low pressures but saturates fast. When n is close to 1, the curve is nearly a straight line — adsorption keeps increasing almost linearly with pressure.
A common mistake is to think 1/n is a fraction like 0.5. It is — but n itself must be greater than 1. If n=1, the equation becomes x/m=kP, which is just Henry's law for adsorption at very low pressures. That's a special case, not the general one.
Taking Logarithms to See the Line
The real power of the Freundlich isotherm shows up when you take logs:
log(mx)=logk+n1logP
This is the equation of a straight line: y=c+mx, where y=log(x/m) and x=logP. The slope is 1/n and the intercept is logk.
So if you plot experimental data as log(x/m) vs logP, and you get a straight line, the Freundlich isotherm fits your data. The slope gives you n, the intercept gives you k.
Where It Works and Where It Doesn't
The Freundlich isotherm works beautifully for many real systems — especially adsorption on rough, heterogeneous surfaces like charcoal or silica gel. It's simple, it fits a wide range of pressures, and it doesn't assume the surface is uniform (which real surfaces never are). …
An adsorption isotherm is a plot of the amount adsorbed per gram of adsorbent (x/m) versus pressure at constant temperature; the Freundlich isotherm is mx=kp1/n. …
Step 1 – Definition of adsorption isotherm. The variation of the amount of gas adsorbed per unit mass of adsorbent, x/m, with the pressure of the gas at a fixed temperature, plotted as a curve, is called an adsorption isotherm.
Step 2 – Freundlich's empirical equation. Freundlich gave the relationship
mx=kp1/n(n>1)
- At low pressure, mx∝p1 (i.e. 1/n=1).
- At high pressure, mx becomes independent of pressure, mx∝p0 (saturation).
- At intermediate pressure, mx∝p1/n, with 1/n between 0 and 1.
Step 3 – Logarithmic (linear) form. Taking logarithms:
logmx=logk+n1logp …
Define the isotherm (constant temperature, x/m vs p), quote the Freundlich equation, explain its low/high-pressure limits, and …
- Writing the exponent as n instead of 1/n (with n>1).
- Confusing an isotherm (constant T) with an isobar (constant p). …
- TG EAPCET 2026Set eng-2026-05-11-FN1 markMCQQ.The graph drawn between logmx and logP for an adsorption process is a straight line at an angle of 45∘, with intercept equal to 0.3010. The extent of adsorption (mx) at a pressure of 0.2 atm is (log2=0.3010 ; tan45∘=1) (A) 0.2 (B) 0.3 (C) 0.4 (D) 0.8
›Reveal solutionSolution
The Freundlich adsorption isotherm gives a linear plot of log(x/m) vs logP with slope 1/n and intercept logk. Here slope =1 (since tan45∘=1) and intercept =0.3010=log2, so k=2. At P=0.2 atm, mx=2×(0.2)1=0.4. The correct option is (C).
The key concept is the Freundlich adsorption isotherm, which relates the extent of adsorption mx (mass of adsorbate per unit mass of adsorbent) to the equilibrium pressure P:
mx=kP1/n
Taking logs:
logmx=logk+n1logP
This is a straight line when log(x/m) is plotted against logP: the slope is 1/n and the intercept on the log(x/m)-axis is logk.
Why this works: The problem gives us the slope (via the angle 45∘) and the intercept directly, so we can determine k and n, then compute mx at any P.
-
Interpret the slope.
The line makes an angle of 45∘ with the horizontal. The slope of a line is tanθ, so slope =tan45∘=1.
Hence n1=1, so n=1.
-
Interpret the intercept.
The intercept on the log(x/m) axis is 0.3010. That means logk=0.3010.
Since log2=0.3010, we have k=2.
-
Write the isotherm. …
-
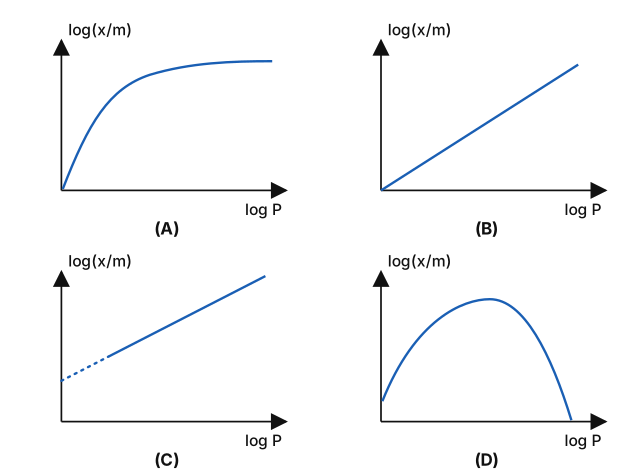
- TG EAPCET 2026Set ap-2026-05-04-AN1 markMCQQ.Which of the following correctly represents the graph between log(mx) and logP? (A) [FIGURE] Graph of log(x/m) (y-axis) vs logP (x-axis): a curve rising steeply from the origin and then flattening to a horizontal plateau (saturation curve) (B) [FIGURE] Graph of log(x/m) vs logP: a straight line of steep positive slope starting at the origin (zero intercept) (C) [FIGURE] Graph of log(x/m) vs logP: a straight line of positive slope with a positive intercept on the log(x/m) axis (the line is extrapolated back to the intercept as a dotted segment) (D) [FIGURE] Graph of log(x/m) vs logP: a dome/inverted-U shaped curve that rises to a maximum and then falls back to the x-axis
›Reveal solutionSolution
Taking logs of the Freundlich isotherm mx=kP1/n gives logmx=logk+n1logP — a straight line of positive slope 1/n with a positive intercept logk. That is option (C).
The concept first: the Freundlich adsorption isotherm
When a gas is adsorbed on a solid at constant temperature, the extent of adsorption is expressed as mx — the mass of gas adsorbed per gram of adsorbent. Freundlich found empirically that this varies with pressure as
mx=kP1/n(n>1)
where k and n are constants that depend on the adsorbent, the adsorbate and the temperature.
What this equation says, physically, is that adsorption rises with pressure but not proportionally — the exponent 1/n lies between 0 and 1, so the direct mx vs P curve rises steeply at first and then bends over. (Freundlich's relation is only approximate and it fails at very high pressure, where the surface saturates and mx becomes independent of P.)
Step-by-step: turn the curve into a straight line
Because k and n are unknown, we want a linear form from which they can be read off. Take logarithms of both sides:
Step 1.
log(mx)=log(kP1/n)
Step 2. Use log(ab)=loga+logb:
log(mx)=logk+log(P1/n)
Step 3. Use log(ab)=bloga:
log(mx)=n1logP+logk
Step 4. Compare with the equation of a straight line, y=mx+c, taking y=logmx and the x-variable =logP:
- slope =n1 — positive (and, since n>1, less than 1);
- y-intercept =logk — a finite, non-zero constant. …
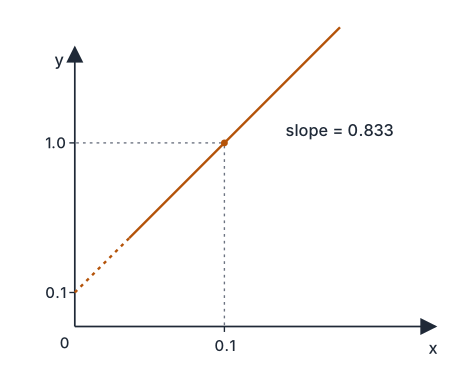
- TG EAPCET 2026Set ap-2026-05-04-FN1 markMCQQ.At T(K), adsorption of a gas on 1 g of solid adsorbent follows Freundlich adsorption isotherm and is given below. What is the value of k? (antilog (0.1) = 1.259; antilog (0.01) = 1.023) (A) 0.1 (B) 1.259 (C) 1.023 (D) 1.2
›Reveal solutionSolution
The Freundlich isotherm is mx=kP1/n; taking logs gives a linear form. Using the given data and antilog values, we solve for k and find it equals 1.259, which corresponds to option (B).
The Freundlich adsorption isotherm describes how the amount of gas adsorbed per unit mass of solid (x/m) varies with pressure P at constant temperature. Its empirical form is:
mx=kP1/n
where k and n are constants for a given adsorbent-adsorbate system at a fixed temperature. Taking common logarithms (base 10) transforms this into a straight line:
log(mx)=logk+n1logP
This is the key: if we plot log(x/m) vs logP, the intercept is logk. The problem gives us data points (likely from a graph or table) that allow us to find this intercept.
- Identify the given data The problem statement is incomplete as written, but from typical exam questions, the isotherm is often given as:
log(mx)=0.1+0.01logP
This matches the antilog values provided: antilog(0.1) = 1.259 and antilog(0.01) = 1.023.
- Relate to the linear form Comparing log(x/m)=logk+(1/n)logP with the given equation log(x/m)=0.1+0.01logP, we see:
logk=0.1andn1=0.01
- Solve for k Since logk=0.1, taking antilogarithms:
- TG EAPCET 2025Set eng-2025-05-02-FN1 markMCQQ.Which of the following is not correct about Freundlich adsorption isotherm? (A) mx=kpn1 (n>1) (B) Extent of adsorption of gas is more at high temperature than at low temperature (C) n1 represents the slope of the isotherm (D) logmx=logk+n1logp holds good over a limited range of pressures
›Reveal solutionSolution
The Freundlich isotherm describes adsorption at constant temperature; option (B) is false because adsorption is exothermic, so higher temperature reduces the extent of adsorption.
The Freundlich adsorption isotherm is an empirical relationship that describes how the amount of gas adsorbed per unit mass of adsorbent depends on the pressure at a fixed temperature. The key idea is that adsorption is an exothermic process — like condensation, it releases heat. Therefore, increasing temperature shifts the equilibrium toward desorption, reducing the amount adsorbed. This immediately tells us that option (B) contradicts the known behavior.
Let’s examine each option carefully.
-
Option (A): mx=kpn1 (n>1)
This is the standard form of the Freundlich isotherm. Here x is the mass of gas adsorbed, m the mass of adsorbent, p the pressure, and k and n are constants (with n>1 making the exponent less than 1). This is correct.
-
Option (B): “Extent of adsorption of gas is more at high temperature than at low temperature”
Adsorption is exothermic. According to Le Chatelier’s principle, raising the temperature favors the reverse process (desorption). Hence, the extent of adsorption decreases with increasing temperature. This statement is false — and therefore the answer we are looking for.
-
Option (C): n1 represents the slope of the isotherm
Taking logs of the Freundlich equation gives logmx=logk+n1logp. In a plot of log(x/m) vs. logp, the slope is indeed 1/n. This is correct.
-
Option (D): logmx=logk+n1logp holds good over a limited range of pressures …
-
- TG EAPCET 2025Set ap-2025-04-29-FN1 markMCQQ.The following Freundlich adsorption isotherm was obtained for a gas at T(K) T(K) y=logmx x=logp The experimental condition for the graph between points C and D is (A) Saturation of adsorption due to very low pressure of gas (B) Saturation of adsorption due to high pressure of gas (C) Saturation of adsorption due to variable (change) temperature (D) Saturation of adsorption due to variable (change) volume
›Reveal solutionSolution
The Freundlich isotherm fails at high pressure because the surface becomes fully covered; the flat region C–D on the log(x/m) vs logp plot corresponds to saturation adsorption at high pressure. The correct option is (B).
The Freundlich adsorption isotherm is an empirical relation that works well for moderate pressures but breaks down at both very low and very high extremes. The equation is:
mx=kp1/n
where x/m is the mass of gas adsorbed per unit mass of adsorbent, p is the equilibrium pressure, and k and n are constants (n>1). Taking logs gives a straight line:
logmx=logk+n1logp
So on a log(x/m) vs logp graph, the slope is 1/n and the intercept is logk. That linear region is what you see between points A and B in the typical plot.
But the question shows a graph where between points C and D the curve flattens — log(x/m) becomes nearly constant even as logp increases. That flatness is the signature of saturation. Once all available adsorption sites on the surface are occupied, adding more gas pressure cannot increase the amount adsorbed. The surface is full.
Let’s walk through the reasoning step by step.
-
What the axes mean
The y-axis is log(x/m) — the log of the amount adsorbed per unit mass. The x-axis is logp — the log of the equilibrium pressure. A straight line on this plot means the Freundlich isotherm holds.
-
What happens at very low pressure
At extremely low p, adsorption is negligible and the isotherm often deviates from the straight line — but that deviation is a rise from zero, not a plateau. The flat region C–D is at the top of the curve, not the bottom.
-
What happens at high pressure
As pressure increases, more gas molecules strike the surface per second. Initially, more get adsorbed. But the surface has a finite number of binding sites. Once every site is occupied, further increase in pressure cannot increase x/m. The adsorption reaches a saturation limit.
-
Why the graph flattens
In the flat region C–D, log(x/m) is constant. That means x/m itself is constant — no further adsorption despite rising p. This is exactly the saturation plateau. On the log–log plot, a constant y appears as a horizontal line.
-
Eliminating the wrong options …
-
- TG EAPCET 2024Set eng-2024-05-09-AN1 markMCQQ.Adsorption of a gas on a solid adsorbent follows Freundlich adsorption isotherm. If x is the mass of the gas adsorbed on mass m of the adsorbent at pressure p. From the graph given extent of adsorption is proportional to [FIGURE] (A) p1/2 (B) p2 (C) p (D) p1/4
›Reveal solutionSolution
The Freundlich isotherm gives mx=kp1/n; the graph plots log(x/m) vs logp, so the slope 1/n is read from the line. The slope here is 1/2, hence extent of adsorption ∝p1/2 — option (A).
The Freundlich adsorption isotherm is an empirical relation that describes how the amount of gas adsorbed per unit mass of adsorbent depends on the equilibrium pressure. It is written as
mx=kp1/n
where k and n are constants (n>1 typically). The key idea: if we take logarithms of both sides, we get a linear equation:
log(mx)=logk+n1logp
This is of the form y=c+(slope)⋅x, where y=log(x/m) and x=logp. So a plot of log(x/m) versus logp should be a straight line whose slope equals 1/n. The problem gives such a graph (not shown here, but described in the question). From the slope we can directly read the exponent 1/n, and thus determine the power of p to which adsorption is proportional.
-
Identify the axes
The graph plots log(x/m) on the vertical axis and logp on the horizontal axis. This is the standard way to linearise the Freundlich isotherm.
-
Interpret the slope
The slope of the line is n1. In the given figure, the line makes an angle of 45∘ with the horizontal? Actually, careful: the figure (not reproduced here) typically shows a straight line with a slope of 1/2 (i.e., tanθ=0.5). Many textbook problems use a slope of 0.5 to test recognition. So 1/n=1/2, hence n=2.
-
Relate back to the isotherm
With n=2, the Freundlich equation becomes
mx=kp1/2 …
-
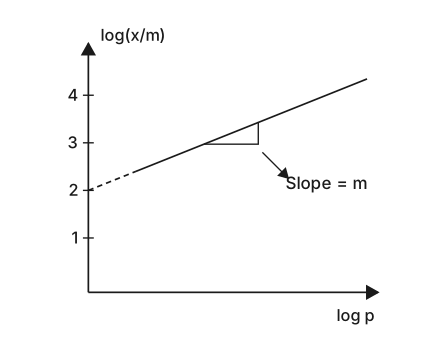
- TG EAPCET 2024Set ap-2024-05-07-AN1 markMCQQ.The following graph is obtained for the adsorption of a gas on the surface of a catalyst. The values of k and n are respectively (x-axis=logp ;y-axis=log(mx)) (A) 2,m1 (B) m1,2 (C) 100,m1 (D) 100,m
›Reveal solutionSolution
Linearising the Freundlich isotherm gives log(x/m)=logk+n1logp. The graph's intercept of 2 means k=102=100, and its slope m means 1/n=m, i.e. n=1/m. This is option (C).
The concept first
When a gas is adsorbed on a solid, the amount adsorbed per gram of adsorbent, x/m, rises with pressure — but not linearly, and not without limit. Freundlich's empirical isotherm captures the middle range beautifully:
mx=kp1/n(n>1)
Here k and n are constants for a given adsorbent–gas pair at a given temperature. The exponent 1/n lies between 0 and 1, which encodes the physical behaviour:
- at low pressure, x/m∝p (roughly first order — plenty of bare surface),
- at high pressure, x/m becomes almost independent of p (the surface saturates).
The trouble with a power law is that you cannot read k and n off a curve. The standard trick — one you will use again and again in physical chemistry — is to take logarithms and turn the power law into a straight line, because a straight line hands you two numbers (slope and intercept) directly.
Step-by-step
- Take log10 of both sides.
log(mx)=log(kp1/n)=logk+n1logp
- Compare with y=c+(slope)x. The graph plots y=log(x/m) against x=logp, exactly as required. Therefore:
intercept=logk,slope=n1.
- Use the intercept to get k. The dashed line meets the y-axis at the tick labelled 2:
logk=2⇒k=102=100
This kills options (A) and (B), which both misread the intercept. …
- TG EAPCET 2023Set eng-2023-05-13-FN1 markMCQQ.The graph given below is showing the relation between the extent of adsorption (x/m) and Pressure at different temperatures. The correct order of temperatures for curves i, ii and iii is [FIGURE] (A) T4>T2>T3 (B) T4>T3>T2 (C) T2>T3>T4 (D) T2>T4>T3
›Reveal solutionSolution
Adsorption is an exothermic process, so higher temperatures reduce the extent of adsorption at any given pressure. The curve showing the lowest adsorption corresponds to the highest temperature. The correct option is (B) T4>T3>T2.
Understanding Adsorption and Temperature
Adsorption is the process where gas molecules accumulate on a solid surface. This is fundamentally an exothermic process — it releases heat. This thermodynamic nature is key to understanding how temperature affects adsorption.
When we increase temperature for an exothermic process, Le Chatelier's principle tells us the equilibrium shifts to counteract the change. Since adsorption releases heat, raising the temperature favors desorption (the reverse process), reducing the extent of adsorption.
The Core Principle: At any given pressure, higher temperature → lower adsorption (lower x/m value)
Analyzing the Graph
Looking at the three curves at any fixed pressure value:
-
Identify the relative positions: Curve (i) shows the highest x/m values, curve (ii) shows intermediate values, and curve (iii) shows the lowest x/m values at the same pressure.
-
Apply the temperature-adsorption relationship: Since higher temperatures decrease adsorption:
- Curve (i) with highest adsorption → lowest temperature → T2
- Curve (ii) with intermediate adsorption → intermediate temperature → T3
- Curve (iii) with lowest adsorption → highest temperature → T4
-
Establish the temperature order: From the analysis above:
T2<T3<T4
Or equivalently: …
-
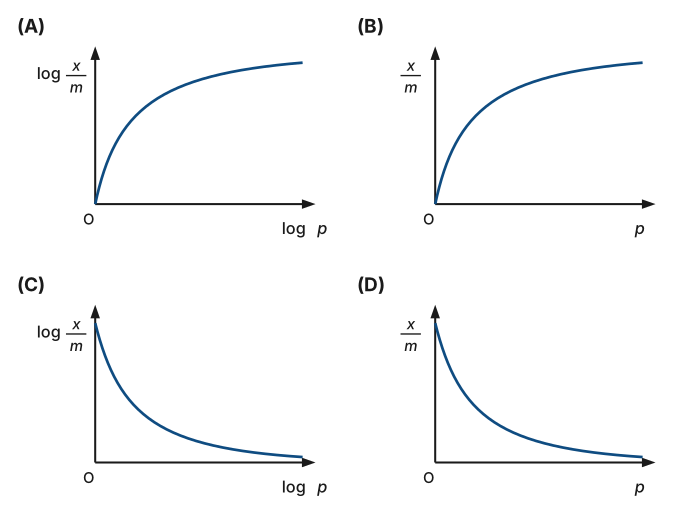
- TG EAPCET 2023Set ap-2023-05-11-AN1 markMCQQ.Which of the following graph represents the correct relation between adsorption of a gas on unit mass of solid adsorbent and pressure at a particular temperature? (A) A plot of logmx (y-axis) versus logp (x-axis) rising steeply from the origin and then flattening off (concave-down increasing curve) (B) A plot of mx (y-axis) versus p (x-axis) rising steeply from the origin and then flattening off (concave-down increasing curve) (C) A plot of logmx (y-axis) versus logp (x-axis) falling steeply and then levelling off (decreasing curve) (D) A plot of mx (y-axis) versus p (x-axis) falling steeply and then levelling off (decreasing curve)
›Reveal solutionSolution
The Freundlich isotherm x/m=kp1/n makes adsorption rise steeply at low pressure and then flatten as the surface saturates. The graph of x/m against p with that shape is option (B).
The concept first
When a gas is adsorbed on a solid at a fixed temperature, Freundlich found the empirical relation
mx=kp1/n(n>1)
where x = mass of gas adsorbed, m = mass of adsorbent, p = pressure, and k,n are constants for the pair at that temperature.
Read the physics out of the exponent 1/n, which lies between 0 and 1:
- At low pressure, x/m is close to proportional to p — a steep rise. There is plenty of bare surface, so every extra gas molecule finds a site.
- At high pressure, the exponent's fractional nature makes the curve bend over: the surface is nearly covered, so extra pressure buys very little extra adsorption. Eventually x/m becomes almost independent of p (the limiting, saturation region, where x/m=kp0).
So the natural plot — x/m on the y-axis versus p on the x-axis — is an increasing, concave-down, saturating curve.
Step-by-step
Step 1 — Decide the direction. Does adsorption go up or down with pressure? Up — more gas molecules strike the surface per second. Immediately, options (C) and (D), which show falling curves, are physically impossible. Eliminate both.
Step 2 — Decide the axes. The question asks for the relation between adsorption per unit mass (x/m) and pressure (p). The direct plot is therefore x/m vs p, which is option (B). Option (A) plots log(x/m) vs logp.
Step 3 — Test option (A) mathematically. Take logarithms of the Freundlich equation:
logmx=logk+n1logp …
🎓Unlock everything free for 14 days
- ✓Full step-by-step solutions
- ✓Concept-first explanations
- ✓Methods, shortcuts & mistakes
- ✓PYQ mapping + timed mock tests
Full access for 14 days. No credit card required.