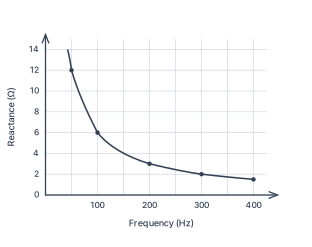
Q.The figure shows the graphical variation of the reactance of a capacitor with frequency of ac source.
You're viewing a preview — the full solution, concept, methods & PYQ mapping are locked.
Start your 14-day free trial to unlock the full solution →Capacitive reactance varies inversely with frequency; from the graph, at Hz gives F. An inductor with the same reactance at that frequency gives H, and its reactance increases linearly with frequency.
The Core Idea: Why Reactance Behaves This Way
A capacitor doesn't resist current like a resistor does. Instead, it opposes changes in voltage by storing and releasing charge. When an AC voltage is applied, the capacitor charges and discharges each cycle — the faster the frequency, the less time it has to build up charge, so the opposition (reactance) drops. This is why the graph shows falling as frequency rises.
For an inductor, the opposite happens: it opposes changes in current by generating a back emf. Higher frequency means faster current changes, so the opposition (inductive reactance) increases linearly with frequency.
The key formulas are:
Capacitive reactance:
Inductive reactance:
Where is the frequency in Hz, and is the angular frequency in rad/s.
Step-by-Step Solution
1. Read the graph carefully
The figure shows on the vertical axis and frequency on the horizontal axis. At Hz, the curve passes through . This is the only clear data point we have — and it's all we need.
A common mistake is to misread the axes. The graph plots (not ) against frequency. The value at 100 Hz is for the capacitor, not the inductor.
2. Find the capacitance (part a)
We use the formula for capacitive reactance:
Rearrange for :
Substitute Hz and :
So the capacitance is about .
You can remember the reciprocal relationship: if is in ohms and in Hz, then in farads is roughly (since ). Here, .
3. Find the inductance (part b)
The problem states: "An ideal inductor has the same reactance at 100 Hz frequency as the capacitor has at the same frequency."
So at Hz:
Using :
So the inductance is about . …
Unlock everything free for 14 days
- Full step-by-step solutions
- Concept-first explanations
- Methods, shortcuts & mistakes
- PYQ mapping + timed mock tests
Full access for 14 days. No credit card required.