Q.(a)
🔒You're viewing a preview — the full solution, concept, methods & PYQ mapping are locked.
🔒 Start your 14-day free trial to unlock the full solution →Part (a)Concept understanding — Nuclear Density Calculation
Nuclear Density: Why All Nuclei Are Almost Equally Dense
Imagine you have a bag of marbles. If you pack them tightly, the density of the bag depends only on the marbles themselves — not on how many you put in. The nucleus behaves the same way. That's the core idea.
The Intuition
An atom's nucleus is made of protons and neutrons (collectively called nucleons). These nucleons are held together by the strong nuclear force, which is extremely short-ranged. Think of it like magnets: each nucleon only "feels" its immediate neighbours. So adding more nucleons doesn't compress the inner ones — it just adds a new layer on the outside.
This means the nucleus grows in volume proportionally to the number of nucleons. Double the number of nucleons, double the volume. And since mass also doubles, the density stays constant.
The Precise Statement
The nuclear radius R is experimentally found to follow:
R=R0A1/3
where:
- A = mass number (total protons + neutrons)
- R0≈1.2×10⁻¹⁵ m (a constant, about 1.2 femtometres)
R=R0A1/3
This is the nuclear radius formula. It's not a guess — it comes from scattering experiments where high-energy electrons or alpha particles bounce off nuclei.
Deriving the Density
The nucleus is roughly spherical, so its volume is:
V=34πR3=34π(R0A1/3)3=34πR03A
Notice: volume is directly proportional to A. The mass of the nucleus is approximately m≈A×(1.67×10⁻²⁷ kg) (mass of one nucleon). So density:
ρ=volumemass=34πR03AA×mnucleon=34πR03mnucleon
The A cancels out completely. The density is a constant — independent of the nucleus size.
Nuclear density is independent of mass number A. All nuclei have approximately the same density.
The Numerical Value
Plug in the numbers:
- mnucleon≈1.67×10⁻²⁷ kg
- R0≈1.2×10⁻¹⁵ m
ρ=34π(1.2×10⁻¹⁵)31.67×10⁻²⁷≈2.3×10¹⁷ kg/m3
That's about 230 million tonnes per cubic centimetre. To put it in perspective: a sugar-cube-sized piece of nuclear matter would weigh as much as 230 million cars.
| Object | Density (kg/m³) |
|--------|-----------------|
| Water | 103 |
| Earth (average) | 5.5×10³ |
| White dwarf star | 109 |
| Atomic nucleus | 2.3×10¹⁷ |
Why This Matters
This constancy of density tells us something profound: the strong nuclear force saturates. Each nucleon only interacts with its nearest neighbours, not with the whole nucleus. If the force were long-range (like gravity), density would increase with size. It doesn't — so the force is short-range. …
Why this formula?
Why Nuclear Density is Constant — The Reasoning
The most striking result about nuclear density is that it is roughly the same for all nuclei, regardless of size. This is not obvious — why wouldn't a larger nucleus be denser? The answer lies in how nuclear force works and how nucleons pack together.
Step 1: The nuclear volume formula
Experiments show that the radius of a nucleus is given by:
R=R0A1/3
where R0≈1.2×10⁻¹⁵ m (1.2 fm) and A is the mass number (total number of protons + neutrons).
The A1/3 dependence is the key. It means volume grows linearly with A, not faster.
Why A1/3? Because nucleons are packed as tightly as possible — like spheres in a close-packed arrangement. If you double the number of nucleons, you need to double the volume, so the radius must increase by 21/3.
Step 2: Volume from the radius
Assuming the nucleus is a sphere:
V=34πR3=34π(R0A1/3)3=34πR03A
Notice: the A1/3 cube gives A directly. So volume is proportional to A.
Step 3: Mass of the nucleus
The mass of the nucleus is approximately:
M≈A⋅mnucleon
where mnucleon≈1.67×10⁻²⁷ kg (the average mass of a proton or neutron). The small mass defect from binding energy is negligible for this calculation.
Step 4: Density
Nuclear density ρ is mass divided by volume:
ρ=VM=34πR03AA⋅mnucleon=34πR03mnucleon
The A cancels completely. Nuclear density is independent of the nucleus size.
Step 5: The numerical value
Plugging in the numbers:
ρ=34π(1.2×10⁻¹⁵)31.67×10⁻²⁷≈2.3×10¹⁷ kg/m3
ρnuclear≈2.3×10¹⁷ kg/m3 …
Part (b)Concept understanding — Rutherford Scattering Distance
Rutherford Scattering Distance – From Intuition to Precision
Imagine you are firing a tiny, fast bullet at a large, heavy cannonball hidden inside a big cloud of cotton. Most bullets zip right through the cotton, barely slowing down. But a few bullets come very close to the cannonball itself. Those bullets get deflected sharply, sometimes even bouncing back.
The Rutherford scattering distance is the answer to this question: How close did that bullet get to the cannonball before it turned around?
In the real experiment, the "bullet" is an alpha particle (a helium nucleus, positively charged), the "cannonball" is the gold nucleus (also positively charged, and very heavy), and the "cotton" is the mostly empty space inside the gold atom. The alpha particle and the gold nucleus repel each other because both are positive. The closer the alpha particle gets, the stronger the repulsion.
The Intuitive Picture
Think of a ball rolling up a steep hill. The ball starts with some speed (kinetic energy). As it climbs, it slows down because gravity is pulling it back. At the very top of its climb, it stops for an instant — all its kinetic energy has been converted into gravitational potential energy. Then it rolls back down.
The alpha particle does the same thing, but with electric repulsion instead of gravity. It approaches the nucleus, slows down, stops at the closest possible point, and then flies back the way it came.
That closest point — the distance of closest approach — is the Rutherford scattering distance. It is the distance at which the alpha particle's initial kinetic energy is completely converted into electrostatic potential energy.
This distance is not the radius of the nucleus. It is the distance at which the alpha particle would just touch the nucleus if the nucleus were a point charge. In reality, the alpha particle never actually reaches the nucleus — it turns around before that.
The Precise Statement
Let an alpha particle with charge +2e and mass m approach a gold nucleus with charge +Ze (where Z=79 for gold). The alpha particle starts from very far away with initial kinetic energy K=21mv2.
At the distance of closest approach, call it r0, the alpha particle's speed becomes zero. All its kinetic energy has become electrostatic potential energy:
K=4πε01⋅r0(2e)(Ze)
Solving for r0:
r0=4πε01⋅K2Ze2
This is the Rutherford scattering distance (also called the distance of closest approach in a head-on collision).
What It Tells Us
- If the alpha particle hits the nucleus head-on, it comes exactly this close before reversing direction.
- If it misses slightly, it comes closer than r0? No — it comes less close. The head-on collision gives the minimum possible distance of closest approach for a given initial energy. Any sideways motion means the particle never gets as close.
- If the initial kinetic energy is larger, r0 becomes smaller — the alpha particle can punch closer to the nucleus before being stopped. …
Why this formula?
Rutherford Scattering: Why the Distance of Closest Approach Formula Works
The distance of closest approach — often denoted d0 or r0 — is the minimum separation between an alpha particle and the nucleus in a head-on collision. It's a beautiful example of energy conservation doing all the heavy lifting.
The Physical Picture
Imagine an alpha particle (charge +2e) fired straight at a gold nucleus (charge +Ze). As it approaches, the Coulomb repulsion slows it down. At the point of closest approach, the alpha particle's radial velocity becomes zero — it stops moving toward the nucleus, and is about to turn around and fly back.
At that instant, all the kinetic energy it had at infinity has been converted into electrostatic potential energy. No other forces are at play (gravity is negligible, and we're far from the nuclear force range).
The Derivation in One Step
Let the alpha particle have initial kinetic energy K=21mv2 at a large distance (where potential energy is zero). At the distance of closest approach r0, its speed is zero, so kinetic energy is zero. Energy conservation gives:
21mv2=4πϵ01⋅r0(2e)(Ze)
r0=4πϵ01⋅K2Ze2
That's it. The formula is a direct consequence of energy conservation in a pure Coulomb field.
Why This Makes Physical Sense
- Higher kinetic energy → the alpha particle can push closer before being stopped → r0 is smaller.
- Higher nuclear charge Z → stronger repulsion → the alpha stops farther away → r0 is larger.
- The factor 2Ze2 comes from the product of charges: (2e)(Ze)=2Ze2.
This is the head-on distance. For non-head-on collisions (nonzero impact parameter), the distance of closest approach is larger because some energy remains in the perpendicular component of motion. The general formula involves the impact parameter b and scattering angle θ, but the head-on case gives the absolute minimum possible approach.
A Common Misconception …
Part (a)
(i) Nuclear radius R=R0A1/3, so volume V=34πR03A and mass ≈Am. Density ρ=34πR03AAm=34πR03m — independent of A, hence the same for all nuclei (∼2.3×10¹⁷ kg m−3). …
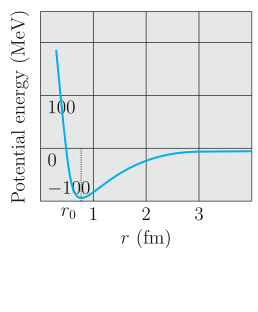
Part (a): ρ=4πR033m is independent of A; the nucleon PE curve reveals a short-range attraction with a repulsive core.
Part (b): the N–θ curve drops steeply — most α's pass through, a few back-scatter — proving the atom has a tiny massive nucleus.
Part (a)
- Nuclear density is constant. The nuclear radius obeys R=R0A1/3 with R0≈1.2 fm. The volume is V=34πR3=34πR03A and the mass is M≈Am (nucleon mass m). Therefore
which has no A, so all nuclei have the same density (≈2.3×10¹⁷ kg m−3).
ρ=VM=34πR03AAm=34πR03m=4πR033m,
- Potential energy vs separation. The graph of PE against nucleon separation r is negative (attractive) with a minimum at r0≈0.8–1.0 fm, rises steeply into a large positive (repulsive) core for r<0.8 fm, and approaches zero for r≳ a few fm. …
Showing the 12 most recent of 15 on this concept.
- CBSE 2026Set 55/1/11 markMCQQ.The 'distance of closest approach' of an alpha-particle is 'd' when it moves with a velocity v head-on towards the target nucleus. If the velocity of alpha particle is halved, the new 'distance of closest approach' will be (A) 2d (B) 2d (C) 4d (D) 4d
›Reveal solutionSolution
At closest approach, all kinetic energy converts to electrostatic potential energy. Since KE∝v2, halving the velocity quarters the kinetic energy, which means the alpha-particle cannot penetrate as deeply — the distance of closest approach becomes 4d.
Why Distance of Closest Approach Depends on Kinetic Energy
When an alpha-particle (α, carrying charge +2e) is fired head-on at a nucleus (charge +Ze), it slows down as electrostatic repulsion does negative work. At the distance of closest approach, the particle momentarily stops: all its initial kinetic energy has been converted into electrostatic potential energy.
The key insight is that the distance of closest approach is determined entirely by energy conservation. The greater the initial kinetic energy, the closer the alpha-particle can get before being turned back.
Step-by-Step Solution
-
Write the energy conservation equation at closest approach.
Initially, the alpha-particle has kinetic energy KE=21mv2 and is far from the nucleus (so PE≈0). At closest approach (distance d), it has zero velocity and maximum potential energy:
21mv2=kd(2e)(Ze)
where k=4πϵ01 is Coulomb's constant.
-
Solve for the distance of closest approach d.
Rearranging:
d=21mv22kZe2=mv24kZe2
This shows that d∝v21.
-
Find the new distance when velocity is halved.
If the new velocity is v′=2v, the new distance d′ is: …
-
- CBSE 2026Set A1 markMCQQ.The nuclear density is approximately (A) independent of mass number (B) directly proportional to mass number (C) inversely proportional to mass number (D) directly proportional to A^(1/3)
›Reveal solutionSolution
Nuclear radius R = R₀A^(1/3), so volume ∝ A and mass ∝ A, making density independent of A.
The nuclear radius follows the empirical relation R=R0A1/3, where R0≈1.2 fm and A is the mass number.
Volume of the nucleus: V=34πR3=34πR03A, so V∝A.
Mass of the nucleus: M≈A×mnucleon, so M∝A.
…
- CBSE 2026Set ANNUAL1 markQ.The perpendicular distance of the initial velocity vector of α-particle from the centre of the nucleus is termed as ________.
›Reveal solutionSolution
This perpendicular distance is called the impact parameter (b); it determines how sharply an alpha particle is deflected in Rutherford scattering.
In Rutherford's alpha-particle scattering experiment, each incoming alpha particle travels toward the nucleus along a straight line in the absence of any deflecting force. The perpendicular distance between this initial (undeflected) line of approach and the centre of the target nucleus is defined as the impact parameter, b. A large impact parameter (the particle's path passes far from the nucleus) gives only a small deflection, while a very small impact parameter (a nearly head-on approach) produ …
- CBSE 2025Set ANNUAL1 markMCQQ.The nuclei have their mass numbers in the ratio of 1:3. The ratio of their nuclear densities would be(a) (3)^(1/3) : 1(b) 1:1(c) 1:3(d) 3:1
›Reveal solutionSolution
Because the nuclear radius scales as R = R0 A^(1/3), the nuclear volume scales exactly as A, so density = mass/volume comes out essentially the same constant for every nucleus, regardless of A.
Nuclear radius: R = R0 A^(1/3), where R0 approx 1.2 fm is a constant.
Nuclear volume: V = (4/3) pi R^3 = (4/3) pi R0^3 A
Since nuclear mass is approximately proportional to A (mass number, roughly A times the nucleon mass), density:
rho = mass / volume is proportional to A / A = constant
…
- CBSE 2025Set ANNUAL1 markQ.The density of nuclear matter is independent of the size of the nucleus. (T/F)
›Reveal solutionSolution
This statement is True — nuclear density is essentially the same for all nuclei, independent of the mass number (size) of the nucleus.
The radius of a nucleus with mass number A is given empirically by R=R0A1/3, where R0≈1.2 fm is a constant. The nuclear volume is then V∝R3∝A, and since the nuclear mass is also proportional to A (each nucleon has roughly the same mass), the density …
- CBSE 2024Set 55/5/11 markMCQQ.Assertion (A): An alpha particle is moving towards a gold nucleus. The impact parameter is maximum for the scattering angle of 180°. Reason (R): The impact parameter in an alpha particle scattering experiment does not depend upon the atomic number of the target nucleus. (A) Both A and R are true and R is the correct explanation of A. (B) Both A and R are true but R is NOT the correct explanation of A. (C) A is true but R is false. (D) Both A and R are false.
›Reveal solutionSolution
Impact parameter b=4πϵ0EZe2cot(θ/2) is minimum (zero) for a head-on collision (θ=180∘), not maximum -- Assertion (A) is false. The same formula shows b depends directly on Z (the atomic number), so Reason (R) is also false. Option (D).
Impact parameter in Rutherford scattering
The impact parameter b (perpendicular distance between the incident alpha particle's initial path and the nucleus) is related to the scattering angle θ by
b=4πϵ0EZe2cot(θ/2),
where Z is the atomic number of the target nucleus and E is the alpha particle's kinetic energy.
b=4πϵ0EZe2cot(2θ) …
- CBSE 2024Set 55/2/11 markMCQQ.An alpha particle approaches a gold nucleus in Geiger-Marsden experiment with kinetic energy K. It momentarily stops at a distance d from the nucleus and reverses its direction. Then d is proportional to : (A) K1 (B) K (C) K1 (D) K
›Reveal solutionSolution
At closest approach, all kinetic energy converts to electrostatic potential energy; equating K=dkq1q2 shows the distance of closest approach is inversely proportional to kinetic energy: d∝K1.
The Geiger-Marsden experiment revealed the nuclear structure of the atom through alpha-particle scattering. When an alpha particle approaches a gold nucleus head-on, it experiences a repulsive Coulomb force that slows it down. At the distance of closest approach, the particle momentarily stops before reversing direction. This is a pure energy-conversion problem: kinetic energy transforms entirely into electrostatic potential energy.
The key insight is conservation of energy. Initially, the alpha particle has kinetic energy K and negligible potential energy (it starts far away). At closest approach distance d, the particle has zero kinetic energy and maximum potential energy.
- Write the initial energy state. Far from the nucleus, the alpha particle has kinetic energy K and potential energy Ui≈0 (taking U=0 at infinity).
Einitial=K+0=K
- Write the final energy state at closest approach. At distance d, the particle stops momentarily, so kinetic energy is zero. The potential energy between the alpha particle (charge qα=2e) and gold nucleus (charge qAu=Ze, where Z=79 for gold) is:
Ufinal=dkqαqAu=dk(2e)(Ze)=d2kZe2
Efinal=0+d2kZe2 …
- CBSE 2024Set A11 markMCQQ.At the distance of closest approach of an α-particle with gold nucleus,(a) both kinetic energy and potential energy are equal(b) entire kinetic energy is converted into potential energy(c) entire potential energy is converted into kinetic energy(d) both kinetic energy and potential energy are zero
›Reveal solutionSolution
(b) entire kinetic energy is converted into potential energy. …
- CBSE 2024Set ANNUAL1 markQ.What is the ratio of nuclear densities of two nuclei having mass number 1:4?
›Reveal solutionSolution
Nuclear density is (almost exactly) the same for all nuclei, regardless of mass number.
Nuclear density is given by ρ=volumemass=34πR3mA, where the nuclear radius scales as R=R0A1/3. Substituting:
ρ=34π(R0A1/3)3mA=34πR03AmA=34πR03m
…
- CBSE 2024Set ANNUAL1 markMCQQ.Two nuclei have mass numbers in the ratio 1:3, the ratio of the nuclear densities are(a) 3:1(b) 1:1(c) 1:9(d) 1:3
›Reveal solutionSolution
Nuclear density ρ=mass/volume∝A/A3⋅3= constant, since the nuclear radius R∝A1/3 makes volume ∝A — so it does not depend on mass number at all.
The empirical nuclear radius formula is R=R0A1/3, where R0≈1.2fm is a constant and A is the mass number. The nuclear volume is
V=34πR3=34πR03A
which is directly proportional to A. The nuclear mass is also (to good approximation) proportional to A, since M≈Au (each nucleon contributes roughly one atomic mass unit).
So the nuclear density is …
- CBSE 2023Set 55/1/11 markMCQQ.The mass density of a nucleus of mass number A is :(a) proportional to A1/3(b) proportional to A2/3(c) proportional to A3(d) independent of A
›Reveal solutionSolution
The mass density of a nucleus is roughly constant for all nuclei because both the mass and the volume scale with the mass number A, making the density independent of A. The correct option is (d).
The key idea here is that a nucleus behaves like a tiny, incompressible drop of nuclear matter. Its volume is proportional to the number of nucleons (protons and neutrons), and its mass is also proportional to that number. When you take the ratio, the A cancels out.
Let’s see why this is true step by step.
-
What is mass number A?
A is the total number of nucleons in the nucleus. The mass of a single nucleon is roughly mn≈1.67×10⁻²⁷ kg. So the mass of the nucleus is approximately M≈A⋅mn. This is a direct proportionality: M∝A.
-
How does the size of a nucleus scale with A?
Experiments (like Rutherford scattering) show that the radius R of a nucleus follows the empirical formula:
R=R0A1/3
where R0≈1.2×10⁻¹⁵ m (about 1.2 femtometers). This is a well-established result — the nuclear volume grows with the number of nucleons.
- What is the volume of the nucleus? Treating the nucleus as a sphere:
V=34πR3=34π(R0A1/3)3=34πR03A
So V∝A. The volume is directly proportional to the number of nucleons.
- Now compute the density: …
-
- CBSE 2022Set ANNUAL1 markQ.Two nuclei have mass numbers in the ratio 1 : 27. What is the ratio of nuclear density?
›Reveal solutionSolution
Nuclear density is the same for all nuclei, so the ratio is 1 : 1.
The nuclear radius is R=R0A1/3, so the nuclear volume is
V=34πR3=34πR03A.
The nuclear mass is proportional to the mass number, m≈Amnucleon. Hence the density is
ρ=Vm=34πR03AAmnucleon=34πR03mnucleon, …
🎓Unlock everything free for 14 days
- ✓Full step-by-step solutions
- ✓Concept-first explanations
- ✓Methods, shortcuts & mistakes
- ✓PYQ mapping + timed mock tests
Full access for 14 days. No credit card required.