Biology · Ch 7 — Plant Growth and Mineral Nutrition
Growth Curve
Growth Curve
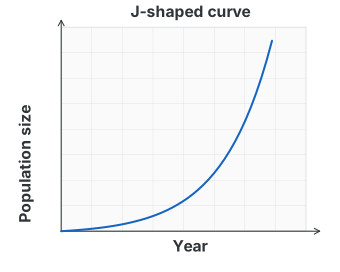
A growth curve is a graphic representation of the total growth against time. There are three types of curves: linear, exponential and sigmoid. The arithmetic growth curve is linear, while the geometric growth curve is exponential - the J-shaped curve of Graph 7.5.
Drawn by us to help you understand the concept clearly, and verified to make sure it's accurate. For exams, practice from your textbook's own diagram.
What this graph shows. Population size on the vertical axis against year on the horizontal axis. The curve stays low for a long time and then shoots upward ever more steeply - the J shape of exponential (geometric) growth, in which the amo …
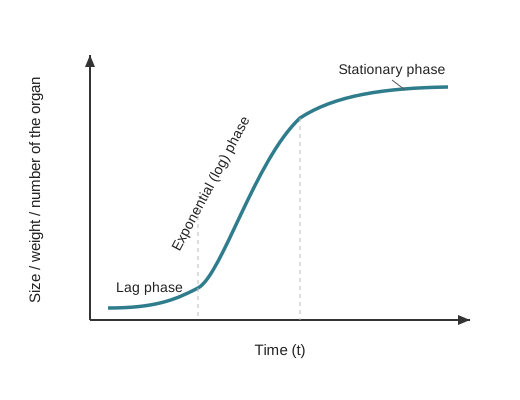
Corresponding to the three distinct phases of growth, the growth rates differ. In the lag phase the growth rate is slow; in the exponential (log) phase it is faster and reaches its maximum; in the stationary phase it gradually slows down. When the growth of an organ (its size or weight) is plotted against time across these three phases, an 'S'-shaped, i.e. sigmoid, curve is obtained (Graph 7.6) - slow at first, steep in the middle and flattening at the end as the rate of growth falls away.
Drawn by us to help you understand the concept clearly, and verified to make sure it's accurate. For exams, practice from your textbook's own diagram.
What this graph shows. Size or weight of the organ against time. The curve starts almost flat (lag phase), climbs steeply (exponential phase) and then levels out (stationary phase) - the sigmoid pattern typic …
…