Q.(a)
🔒You're viewing a preview — the full solution, concept, methods & PYQ mapping are locked.
🔒 Start your 14-day free trial to unlock the full solution →Part (a)Concept understanding — Double Slit Interference
Double Slit Interference: From Ripples to Light
Imagine dropping two stones into a still pond at the same time, a short distance apart. Watch the ripples spread. Where a crest from one stone meets a crest from the other, the water rises higher. Where a crest meets a trough, the water flattens out. That is interference — waves adding or cancelling.
Now replace the water with light. Replace the stones with two narrow slits cut into a barrier. Shine a single colour of light (say, red laser light) onto the slits. On a screen behind the barrier, you do not see two bright spots. Instead, you see a pattern of alternating bright and dark bands — like a striped zebra crossing made of light.
That pattern is double slit interference. It is the single most convincing proof that light behaves as a wave.
The Core Idea
Light from a single source passes through two narrow slits. Each slit acts as a new source of waves. These two sets of waves spread out and overlap. At any point on the screen, the light you see is the sum of the waves from slit 1 and slit 2.
Whether they add (bright) or cancel (dark) depends on one thing: the path difference — how much farther one wave has travelled compared to the other.
For constructive interference (bright band): path difference = nλ (whole number of wavelengths)
For destructive interference (dark band): path difference = (n+21)λ (half-integer number of wavelengths)
Here λ is the wavelength of the light, and n=0,1,2,…
The Geometry
Let the slits be separated by distance d. The screen is far away at distance D (D≫d). For a point on the screen at angle θ from the centre:
- The path difference Δx=dsinθ
- Bright bands occur when dsinθ=nλ
- Dark bands occur when dsinθ=(n+21)λ
The position y of the n-th bright band on the screen (measured from the centre) is:
yn=dnλD
The spacing between consecutive bright bands (fringe width) is:
β=dλD
Fringe width β=dλD
What This Tells You
- Larger λ → wider fringes (red light spreads more than blue)
- Larger D → wider fringes (screen further away spreads the pattern)
- Smaller d → wider fringes (slits closer together spread the pattern more)
If you cover one slit, the pattern vanishes — you get a single blurry blob. The stripes only appear when both slits are open, proving that the light from the two slits is interfering.
Why It Matters
Double slit interference is not a classroom toy. It is the foundation of:
- Young's experiment (1801) — which settled the debate: light is a wave
- Diffraction gratings — used in spectrometers to identify elements by their light …
Why this formula?
Double Slit Interference: Why the Formula Holds
Let's build the understanding from first principles — not just memorise the formula, but see why it must be true.
1. The Core Idea: Path Difference Creates Phase Difference
Imagine two narrow slits S1 and S2, separated by distance d, illuminated by a single coherent source. Light from each slit travels to a point P on a screen at distance D (where D≫d).
- The two waves start in phase at the slits (same source).
- They travel different distances to reach P.
- This path difference Δx causes a phase difference Δϕ.
Key relation:
Δϕ=λ2π⋅Δx
Why? Because one full wavelength λ corresponds to a phase change of 2π radians.
2. Finding the Path Difference
From the geometry (see diagram in any textbook):
- For a point P at angle θ from the central axis, the extra distance travelled by the wave from the farther slit is approximately:
Δx=dsinθ
Why approximate? Because we assume D≫d, so the two paths are nearly parallel. This is the Fraunhofer (far-field) approximation — valid for most exam setups.
3. Condition for Constructive Interference (Bright Fringes)
Waves interfere constructively when they arrive in phase:
Δϕ=2πm(m=0,±1,±2,…)
Using Δϕ=λ2π⋅dsinθ, we get:
λ2π⋅dsinθ=2πm
Cancel 2π to obtain the bright fringe condition:
dsinθ=mλ
- m is called the order of the fringe.
- m=0 gives the central bright fringe (straight ahead).
4. Condition for Destructive Interference (Dark Fringes)
Waves interfere destructively when they arrive out of phase by π (half a cycle):
Δϕ=(2m+1)π
Substitute again:
λ2π⋅dsinθ=(2m+1)π
Cancel π to get the dark fringe condition:
dsinθ=(m+21)λ
5. From Angle to Position on Screen
For small angles (typical in exam problems), sinθ≈tanθ=Dy, where y is the distance from the central maximum on the screen.
Bright fringe position:
ym=dmλD
Dark fringe position:
ym=d(m+21)λD …
Part (b)Concept understanding — Compound Microscope Magnification
What a Compound Microscope Does
A single magnifying glass can only magnify so much before the image gets too
blurry to use. A compound microscope solves this by using two converging
lenses in sequence: the objective (short focal length, closest to the tiny
object) forms a real, enlarged image first, and the eyepiece (acting as a
simple magnifier) then magnifies that image further before it reaches your eye.
"Compound" just means the total magnification is the product of what each lens
contributes on its own.
The Two-Stage Picture
- Objective lens — the object sits just beyond the objective's focal point fo, so it forms a real, inverted, enlarged image inside the tube.
- Eyepiece — that real image now acts as the "object" for the eyepiece, which is positioned so the image it forms is easy for a relaxed eye to view.
The distance between the objective's image and the eyepiece is the tube length, usually written L.
Magnifying Power: Image at Infinity (Normal Adjustment)
The most common case tested is when the eyepiece is adjusted so the final image
forms at infinity (a relaxed eye needs no accommodation). Here the total
magnifying power is:
M=foL×feD
Where:
- L = tube length (separation between objective and eyepiece)
- fo = focal length of the objective
- fe = focal length of the eyepiece
- D = the least distance of distinct vision (usually 25 cm)
M=foL⋅feD
Why it looks like this: L/fo is (approximately) the objective's own
linear magnification — a real image formed far beyond fo is much bigger than
the object. D/fe is the eyepiece behaving as a simple magnifier viewing that
image. Multiplying the two stages gives the total magnifying power.
Magnifying Power: Image at the Near Point
If instead the eyepiece is adjusted so the final image forms at the near point
D (maximum magnification, but the eye must accommodate), the eyepiece
contributes a slightly larger factor:
M=foL(1+feD)
Don't mix the two formulas up. "Image at infinity" (relaxed eye) uses
D/fe; "image at the near point" (maximum magnification, eye strained) uses
1+D/fe. A question that doesn't specify usually means normal adjustment
(image at infinity).
Why Both Lenses Need Short Focal Lengths
To get large magnifying power, both fo and fe should be small — but the
objective's focal length matters most for a different reason too: a very
short fo lets the object be placed very close to the lens, which is what lets
a microscope resolve tiny structures a simple magnifier never could.
Worked Example
Problem: A compound microscope has an objective of focal length 1.0 cm
and an eyepiece of focal length 5.0 cm. The tube length is 20 cm
and the final image is formed at infinity (normal adjustment, D=25 cm). …
Part (a)
(i) Interference vs diffraction (any two):
| Young's double-slit interference | Single-slit diffraction |
|---|---|
| Fringes are of nearly equal width and intensity | Central maximum is widest and brightest; intensity falls off rapidly |
| Superposition from two coherent sources (the slits) | Superposition from many secondary sources across one slit |
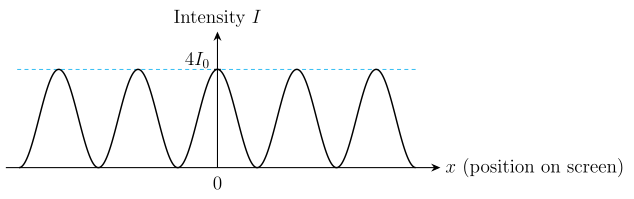
(ii) Intensity distribution (double slit): equally spaced cos2 maxima of nearly equal height (slowly modulated by the single-slit envelope); axes I vs position, peaks at dsinθ=nλ.
(iii) Intensity at path difference λ/6. With I=Imaxcos2(ϕ/2) and ϕ=λ2πΔx: at Δx=λ, ϕ=2π, so I=Imax=K. At Δx=λ/6, ϕ=π/3: …
Part (a): interference and diffraction differ in fringe origin and intensity envelope; the double-slit intensity is cos2-modulated, and at path difference λ/6 the intensity is 43K. Part (b): the compound-microscope magnifying power is M=foL(1+feD), and the telescope's magnifying power for a final image at infinity is 20.
Part (a)
(i) Two differences
- Origin of the fringes: interference fringes come from the superposition of light from two coherent slits; diffraction fringes come from the superposition of secondary wavelets from different parts of the same slit.
- Intensity envelope: in double-slit interference all bright fringes have nearly the same intensity and width; in single-slit diffraction the central maximum is about twice as wide and far brighter than the rapidly weakening secondary maxima.
(ii) Intensity distribution graph (double slit)
I=I0cos2(λπdsinθ).
The graph (I vs position/θ) shows evenly spaced bright fringes of nearly equal height with dark minima between them (bounded by a broad single-slit diffraction envelope).
(iii) Intensity at path difference λ/6
For two coherent sources of equal intensity the resultant is
I=Imaxcos2(2ϕ),ϕ=λ2πΔx.
Step 1 — calibrate Imax. At Δx=λ, ϕ=2π, so cos2(π)=1 and I=Imax=K.
Step 2 — at Δx=λ/6: ϕ=λ2π⋅6λ=3π.
Step 3 — evaluate: …
Showing the 12 most recent of 32 on this concept.
- CBSE 2026Set 55/1/11 markMCQQ.The shape of the interference fringes in Young's double-slit experiment, when the distance between the slit and the screen is very large as compared to the slit-separation, is nearly (A) straight (B) parabolic (C) circular (D) hyperbolic
›Reveal solutionSolution
When the screen is very far from the slits compared to their separation, points of constant path difference lie on nearly straight lines parallel to the slits, making the fringes straight.
The key to understanding fringe shape lies in recognizing what an interference fringe actually represents: it is the locus of all points on the screen where the path difference from the two slits is constant.
In Young's double-slit experiment, we have two coherent sources S1 and S2 separated by distance d. A point P on the screen at distance D from the slits will show constructive or destructive interference depending on the path difference Δ=∣S2P−S1P∣.
For a bright fringe of order n, we need Δ=nλ. The question is: what is the shape of the curve connecting all points P that satisfy this condition?
Geometry of path difference
Consider a point P on the screen at coordinates (x,y) if we place the origin midway between the slits. The two slits are at positions roughly (0,±d/2,0) in 3D space, and the screen is at distance D along the perpendicular.
The exact path difference is:
Δ=D2+(y−d/2)2+x2−D2+(y+d/2)2+x2
This is the general equation for a hyperbola in the xy-plane. So strictly speaking, fringes are hyperbolic curves.
The far-field approximation
Now comes the crucial condition: D≫d (screen distance much larger than slit separation).
When D is very large, we can use the binomial approximation. For the path from S2 to P:
S2P=D1+D2(y−d/2)2+x2≈D+2D(y−d/2)2+x2
Similarly for S1P. The path difference becomes:
Δ≈2D(y−d/2)2−(y+d/2)2=2D−2yd=−Dyd
(The x2 terms cancel out.)
For constant path difference Δ=nλ, we get:
y=−dnλD=constant …
- CBSE 2026Set 55/2/11 markMCQQ.Two statements are given – one labelled Assertion (A) and the other Reason (R). Select the correct answer from the codes below: (A) Both (A) and (R) are true and (R) is the correct explanation of (A). (B) Both (A) and (R) are true, but (R) is not the correct explanation of (A). (C) (A) is true, but (R) is false. (D) (A) is false and (R) is also false. Assertion (A) : Light added to light can produce darkness. Reason (R) : When two coherent light waves interfere, there is darkness at the position of destructive interference.
›Reveal solutionSolution
Interference of coherent light waves can indeed produce darkness at points of destructive interference; both statements are true and the reason correctly explains the assertion. The answer is (A).
Why light can produce darkness
The assertion sounds paradoxical at first—how can adding light to light create darkness? The resolution lies in understanding that light is a wave phenomenon, and waves don't simply add arithmetically in intensity. Instead, they superpose according to their phase relationship.
When two coherent light waves (waves with a constant phase relationship) meet, their electric field amplitudes add vectorially. If they arrive in phase, the amplitudes reinforce (constructive interference, brighter light). If they arrive exactly out of phase—crest meeting trough—the amplitudes cancel (destructive interference), and the resultant intensity becomes zero or near-zero. This is darkness produced by adding light to light.
The reason statement captures precisely this mechanism: destructive interference between coherent waves creates regions of darkness.
Examining the statements
-
Assertion (A): "Light added to light can produce darkness"
This is experimentally verified in phenomena like Young's double-slit experiment, thin-film interference, and Newton's rings. At certain positions on the screen or observation plane, the intensity drops to zero despite light arriving from two sources. The statement is true.
-
Reason (R): "When two coherent light waves interfere, there is darkness at the position of destructive interference"
Destructive interference occurs when the path difference between two coherent waves is an odd multiple of half-wavelengths:
Δ=(m+21)λ,m=0,1,2,… …
-
- CBSE 2026Set A1 markMCQQ.The phase difference φ is related to path difference λ by (A) (λ/π)φ (B) (π/λ)φ (C) (λ/2π)φ (D) (2π/λ)φ
›Reveal solutionSolution
Phase difference = (2π/λ) × path difference.
The fundamental relation between phase difference (Δϕ) and path difference (Δx) is
Δϕ=λ2πΔx.
…
- CBSE 2026Set A1 markMCQQ.For destructive interference, the path difference should be equal to (A) nλ (B) (2n+1)λ/2 (C) zero (D) infinity
›Reveal solutionSolution
Destructive interference occurs when the path difference is an odd multiple of λ/2.
Two waves interfere destructively (cancel) when they arrive exactly out of phase, i.e. a phase difference of π,3π,5π,…. In terms of path difference this means an odd multiple of half a wavelength:
…
- CBSE 2026Set ANNUAL1 markQ.The displacement of water molecules at any instant on the surface of water at nodal lines is ______.
›Reveal solutionSolution
Nodal lines are where two overlapping waves are always exactly out of phase, so their displacements cancel completely at every instant, leaving zero net displacement.
When two coherent water-wave sources produce overlapping ripples, at points on a nodal line the crest of one wave always coincides with the trough of the other (path difference = odd multiple of half wavelength), so d …
- CBSE 2025Set 55/5/11 markMCQQ.A compound microscope has an objective and an eyepiece of focal lengths fo and fe respectively. To obtain a large magnification of a small object, the microscope should have: (A) fo and fe small, and fe>fo (B) fo and fe small, and fo>fe (C) fo and fe large, and fe>fo (D) fo and fe large, and fo>fe
›Reveal solutionSolution
A compound microscope achieves high magnification when both lenses have short focal lengths, with the objective's focal length shorter than the eyepiece's: fo and fe small, and fe>fo. The correct option is (A).
Why focal lengths matter for magnification
A compound microscope uses two converging lenses in tandem. The objective forms a real, magnified image of the tiny object, and the eyepiece acts as a magnifying glass to view that intermediate image. The total magnification is the product of the magnifications produced by each lens, so to maximize it we need to understand how each focal length enters the formula.
The objective's magnification depends on how far the real image forms relative to the object distance. For a small object placed just beyond the focal point of the objective, the image distance vo is much larger than the object distance uo, giving magnification mo=uovo. In the standard microscope setup, the object is very close to the focus, so uo≈fo, and the image forms near the other end of the tube at distance L (the tube length). This gives:
mo≈foL
The eyepiece magnifies the intermediate image like a simple magnifying glass. When the final image is at the near point D (typically 25 cm), the angular magnification is:
me=1+feD
For large D compared to fe, this simplifies to me≈feD.
M=mo×me≈foL×feD=fofeLD
Step-by-step analysis
-
Total magnification is inversely proportional to both focal lengths. From the formula above, M∝fofe1. To maximize M, we need both fo and fe to be as small as possible. This immediately rules out options (C) and (D), which suggest large focal lengths.
-
Compare the two focal lengths. Now we must decide between options (A) and (B): should fe>fo, or fo>fe?
-
Physical constraints of microscope design. In a practical compound microscope, the objective must form a real image at a reasonable distance (the tube length L, typically 15–20 cm). If fo were too large, the object would need to be placed far from the lens, defeating the purpose of examining a small specimen up close. The objective typically has fo in the range of a few millimetres to about 2 cm. …
-
- CBSE 2025Set 55/5/11 markMCQQ.Two coherent light waves, each having amplitude a, superpose to produce an interference pattern on a screen. The intensity of light as seen on the screen varies between: (A) 0 and 2a2 (B) 0 and 4a2 (C) a2 and 2a2 (D) 2a2 and 4a2
›Reveal solutionSolution
When two coherent waves of equal amplitude a interfere, the resultant amplitude varies from 0 (destructive) to 2a (constructive); since intensity is proportional to the square of amplitude, the intensity range is 0 to 4a2.
The heart of this problem lies in understanding how wave superposition affects intensity. When two coherent waves meet, they don't simply add their intensities — instead, their amplitudes add vectorially, and the resulting intensity depends on the square of this net amplitude.
For light waves, intensity I is proportional to the square of the amplitude: I∝A2. If we set the proportionality constant to unity for simplicity (which is standard when comparing relative intensities), then I=A2.
Now let's trace what happens when two coherent waves, each with amplitude a, interfere.
The amplitude addition principle
At any point on the screen, the two waves arrive with some phase difference δ (which depends on the path difference). The resultant amplitude is found by vector addition:
Anet=a1+a2
where a1 and a2 are the individual wave amplitudes treated as phasors. For two waves of equal amplitude a with phase difference δ:
Anet=a2+a2+2a⋅acosδ=a2(1+cosδ)
Using the identity 1+cosδ=2cos2(δ/2):
Anet=2acos2δ
Finding the intensity extremes
- Maximum amplitude (constructive interference): When δ=0,2π,4π,… (waves in phase), we have cos(δ/2)=1, so:
Amax=2a
The maximum intensity is:
Imax=Amax2=(2a)2=4a2 …
- CBSE 2025Set 55/6/11 markMCQQ.Two coherent waves, each of intensity I0, produce interference pattern on a screen. The average intensity of light on the screen is: (A) zero (B) I0 (C) 2I0 (D) 4I0
›Reveal solutionSolution
Interference redistributes light energy across the screen but cannot create or destroy it, so the average intensity equals the sum of the two individual intensities: I0+I0=2I0. The correct option is (C).
When two coherent waves meet, they produce bright and dark fringes. At some points they add constructively (bright), at others destructively (dark). The question asks for the average intensity over the whole screen — not the maximum or minimum at any particular point.
The key insight is energy conservation. The two sources together deliver a fixed amount of energy to the screen. Interference only redistributes this energy — concentrating it in bright fringes and depleting it in dark ones — it cannot create or destroy energy. So the average over the pattern must equal what the two waves would deliver independently.
Let's confirm this with the intensity formula.
- Write the resultant intensity at a point. For two coherent waves of intensity I0 each, meeting with phase difference δ:
I=I0+I0+2I0⋅I0cosδ=2I0(1+cosδ)
This varies from Imax=4I0 (at δ=0,2π,…) down to Imin=0 (at δ=π,3π,…).
- Average over the pattern. As you move across the screen, the phase difference δ sweeps uniformly through all values from 0 to 2π:
⟨I⟩=2I0(1+⟨cosδ⟩)
-
Evaluate the average of cosine.
Over a complete cycle, ⟨cosδ⟩=0.
-
Conclude.
⟨I⟩=2I0(1+0)=2I0 …
- CBSE 2025Set X11 markMCQQ.Which one of the following statements is WRONG about interference of light?(a) Light waves of same wavelength coming from two independent sources can be coherent and can produce interference(b) When the path difference between two interfering waves in nλ, bright fringe is produced (Here n=0,1,2,… and λ is the wavelength of light)(c) When the phase difference between two interfering waves is (2n+1)π, dark fringe is produced (Here n=0,1,2,…)(d) In Young's double slit experiment, dark and bright fringes are equally spaced
›Reveal solutionSolution
(a) — this is the WRONG statement. Two independent sources cannot maintain a constant phase relationship, so they are not coherent and cannot produce a stable interference pattern; coherent sour …
- CBSE 2025Set D1 markMCQQ.Two light waves of equal amplitude and equal wavelengths are superimposed. The amplitude of the resultant wave will be maximum when phase difference between them is (A) zero (B) π/4 (C) π/2 (D) π
›Reveal solutionSolution
Two equal-amplitude waves add to a maximum when they are in phase, i.e. phase difference = 0.
For two waves of amplitude a with phase difference φ, the resultant amplitude is
A = √(a² + a² + 2a·a·cosφ) = 2a·cos(φ/2)
…
- CBSE 2025Set D1 markMCQQ.The bubble of soap appears coloured due to (A) diffraction (B) polarization (C) interference (D) reflection
›Reveal solutionSolution
Thin-film interference between the two reflected rays gives colour, since which wavelength interferes constructively depends on the film thickness.
A soap film is a very thin layer of liquid. Light reflected from its front surface interferes with light reflected from its back surface (thin-film interference).
…
- CBSE 2025Set A1 markQ.Fill in the blank with appropriate word: ______ of light shows redistribution of energy.
›Reveal solutionSolution
Interference of light merely redistributes energy between bright and dark regions; it does not create or destroy energy.
When two coherent light waves superpose, they produce a pattern of alternating bright and dark fringes. At points of constructive interference, the resultant intensity is greater than the sum of individual intensities (extra brightness), while at points of destructive interference the resultant intensity is less (often close to zero). Averaged over the whole pattern, however, the total energy is exactly conserved — …
🎓Unlock everything free for 14 days
- ✓Full step-by-step solutions
- ✓Concept-first explanations
- ✓Methods, shortcuts & mistakes
- ✓PYQ mapping + timed mock tests
Full access for 14 days. No credit card required.