Electronics · Ch 8 — Modulation and Demodulation
Analysis of Amplitude Modulated Wave
Analysis of Amplitude Modulated Wave
To describe an AM wave mathematically, let the modulating signal be
and the carrier be
where the carrier phase is ignored for simplicity and . During amplitude modulation the carrier amplitude is no longer constant but becomes
The instantaneous AM signal is therefore
Here is called the modulation index (also modulation factor or depth of modulation). Expanding equation (8.5) using a product-to-sum identity gives the AM wave as the sum of three components:
These three terms are the carrier (amplitude , frequency ), the lower sideband (amplitude , frequency ) and the upper sideband (amplitude , frequency ). Notably, the modulated wave contains no component at the original modulating frequency .
Frequency spectrum of AM wave
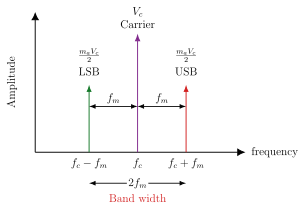
A frequency spectrum is a graph of the amplitude of a wave versus frequency. For an AM wave (Figure 8.2.2) it consists of three vertical lines: the carrier at (height ), the lower side frequency at and the upper side frequency at , each of height , spaced equally on either side of the carrier. The two side frequencies are the sidebands — the sum and difference signals produced by modulation. The carrier itself carries no information; the message resides entirely in the sidebands.
Bandwidth
The bandwidth of the AM wave is the frequency range from the lower to the upper sideband:
So an AM channel needs a bandwidth of twice the highest modulating frequency. In practice a medium-wave AM broadcast station is allocated a 9 kHz-wide channel.
Modulation index
For proper amplitude modulation must be less than , so that
lies between 0 and 1, with a maximum permitted value of 1.0. If exceeds then , which causes over-modulation and a distorted envelope. The modulation is often stated as a percentage:
Modulation index from V_max and V_min
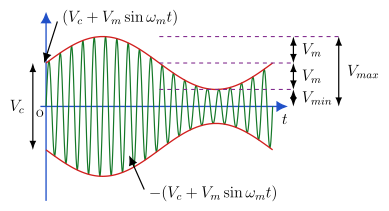
The modulation index can be found directly from an AM waveform displayed on an oscilloscope (Figure 8.2.3). The maximum and minimum envelope amplitudes are
Adding and subtracting these gives
so that the standard working formula is
When the AM wave is observed as an antenna current instead of a voltage, the same relation holds with currents:
Modulated waves with various degrees of modulation
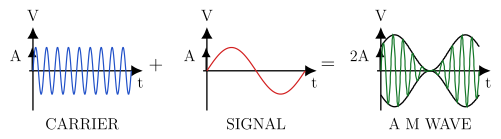
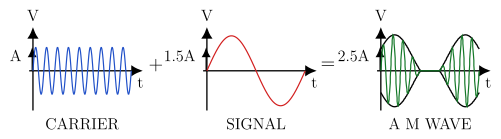
The shape of the AM wave depends on the value of :
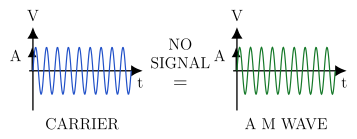
- (Figure 8.2.4): no modulating signal; the output is just the unmodulated carrier of constant peak amplitude . …
(8.1) and (8.2), with , and . Here and are the peak amplitudes and the frequencies of the message and carrier (with the carrier phase ignored); these two expressions …
(8.5), obtained from with the modulated amplitude . Here is the modulation index; expanding this product with a product-to-sum identity gives the AM w …
: the ratio of modulating-signal amplitude to carrier amplitude. It must lie between 0 and 1 (maximum 1.0); a value greater than 1 causes over-modulation and envelope distortion. Because it fixes both the quality and the strength of the transmitted signal, the modulation …
(8.6): the carrier at , the lower sideband at and the upper sideband at , the …
The sum frequency (upper sideband) and difference frequency (lower sideband) produced by modulation. Each has amplitude ; the carrier carries no information, so all t …
(8.7): twice the highest modulating frequency. Here is the upper side frequency and the lower one, so an AM channel needs a bandwidth of twice the highest modulating frequency; a medium-wave A …
(8.9), the modulation index expressed as a percentage. Here is the modulating-signal amplitude and the carrier amplitude, so the percentage is simply the modulation index scaled by 100. For undistorted AM it stays at or below 100%; a higher v …
(8.14), with . This is the standard method of measuring from an oscilloscope trace. Here and are the peak and trough amplitudes of the AM envelope, read directly from an oscilloscope trace, so no separate k …
(8.15), used when the AM wave is measured as an antenna current. Here and are the maximum and minimum envelope currents; this mirrors the voltage form and is used when the AM wave is …
Drawn by us to help you understand the concept clearly, and verified to make sure it's accurate. For exams, practice from your textbook's own diagram.
Figure 8.2.2 (Frequency spectrum of AM wave): amplitude-versus-frequency graph with the carrier line at (height ) flanked by the lower sideband at and upper sideband at , each of height ; …
Drawn by us to help you understand the concept clearly, and verified to make sure it's accurate. For exams, practice from your textbook's own diagram.
Figure 8.2.3 (Amplitude modulated wave): a modulated carrier whose upper envelope traces and lower envelope its mirror image; the right side brackets the peak envelope and trough , and the left marks the unmodulated carrier level . Used to …
Drawn by us to help you understand the concept clearly, and verified to make sure it's accurate. For exams, practice from your textbook's own diagram.
Figure 8.2.4 (Amplitude modulation for ): with no modulating signal the AM wave equals the unmodulated carrier of constant amplitude . What to notice: the peak amplitude stays constant and the envelope is a flat, unchanging line — with no message applied there is nothing to trace, so the output is in …
Drawn by us to help you understand the concept clearly, and verified to make sure it's accurate. For exams, practice from your textbook's own diagram.
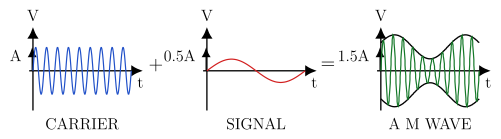
Figure 8.2.5 (Amplitude modulation for ): carrier of amplitude plus a 0.5A signal gives an AM wave peaking at 1.5A whose envelope keeps a distinct waist and does not touch zer …
Drawn by us to help you understand the concept clearly, and verified to make sure it's accurate. For exams, practice from your textbook's own diagram.
Figure 8.2.6 (Amplitude modulation for ): carrier plus an equal-amplitude signal gives an AM wave peaking at 2A whose envelope pinches down to touch the zero axi …
Drawn by us to help you understand the concept clearly, and verified to make sure it's accurate. For exams, practice from your textbook's own diagram.
Figure 8.2.7 (Amplitude modulation for ): a 1.5A signal over-modulates the carrier; the envelope peaks at 2.5A and is flattened near zero with the negative peaks clipped, producing …