Electronics · Ch 5 — Operational Amplifiers
Active filters
Active filters
Active filters use passive components (resistors and capacitors) together with active components (op-amps) to select a band of frequencies. The op-amp provides amplification and also isolates or buffers the filter stage from the following circuit.
Active low-pass filter
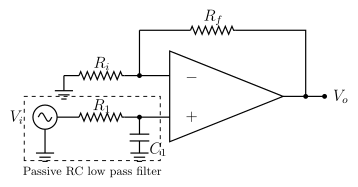
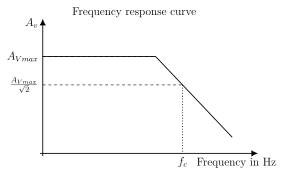
An ideal low-pass filter passes signals from zero frequency up to a cut-off frequency with constant gain, and blocks everything above . A first-order low-pass active filter is a single RC low-pass stage followed by an op-amp connected as a non-inverting amplifier (figure 5.8.1); its frequency response is shown in figure 5.8.2. Using two RC sections gives a second-order low-pass active filter, whose gain rolls off faster and is therefore closer to the ideal response.
The theoretical cut-off frequency and the voltage gain are
Active high-pass filter …
Drawn by us to help you understand the concept clearly, and verified to make sure it's accurate. For exams, practice from your textbook's own diagram.
Figure 5.8.1 shows the first-order low-pass active filter. A passive RC low-pass network (source Vi in series with resistor R1, and capacitor C1 from that node to ground, enclosed in a dashed box) drives the non-inverting (+) input of the op-amp. The op-amp is wired as a non-inverting amplifier with input resistor Ri (to a grounded node) and feedback resistor Rf, giving output Vo. The RC netw …
Drawn by us to help you understand the concept clearly, and verified to make sure it's accurate. For exams, practice from your textbook's own diagram.
Figure 5.8.2 shows the low-pass frequency response. The vertical axis is voltage gain Av and the horizontal axis is frequency in Hz. The gain is flat at Av(max) from zero up to the cut-off, then slopes down. A dashed line at Av(max)/sqrt(2) meets the falling slope, and a vertical dotted line drops from that p …
Cut-off frequency ; voltage gain (op-amp as non-inverting amplifier) . The same two expressions apply to both the low-pass and the h …
Drawn by us to help you understand the concept clearly, and verified to make sure it's accurate. For exams, practice from your textbook's own diagram.
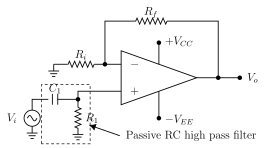
Figure 5.8.3 shows the first-order high-pass active filter. A passive RC high-pass network (source Vi in series with capacitor C1, and resistor R1 from the C1-R1 junction to ground, in a dashed box) drives the non-inverting (+) input of the op-amp. The op-amp is a non-inverting amplifier with input resistor Ri and feedback resistor Rf, supply pins +Vcc and -Vee, output Vo. Placing the capacit …
Drawn by us to help you understand the concept clearly, and verified to make sure it's accurate. For exams, practice from your textbook's own diagram.
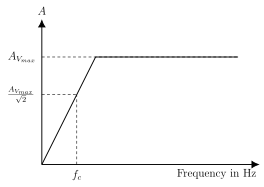
Figure 5.8.4 shows the high-pass frequency response. The vertical axis is gain and the horizontal axis is frequency in Hz. The curve rises from the origin, crosses Av(max)/sqrt(2) at the cut-off frequency fc (marked by dashed lines), then flattens to a plate …