Physics · Ch 4 — Thermodynamics
Reversible and Irreversible Processes
Reversible and Irreversible Processes
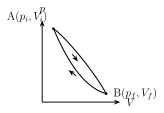
Consider two objects at different temperatures brought into thermal contact: heat flows from the hotter object to the colder one until they reach a common temperature (Section 4.2). But this process never runs backward on its own — you never observe the two objects spontaneously separating back to their original, different temperatures. The object that was hotter never becomes hot again by itself, and the object that was colder never becomes cold again by itself, once thermal equilibrium has been reached. A process like this, which does not restore the system's initial state on its own, is called an irreversible process. Puncturing an inflated balloon or tyre, rubbing your palms together, and burning a candle are all everyday examples of irreversible processes — none of them can be 'run backward' to undo themselves.
Some processes, by contrast, genuinely can be reversed — melting ice, freezing water, boiling water, and condensing steam are all familiar examples where the system's initial state can be fully restored by reversing the conditions. These are called reversible processes.
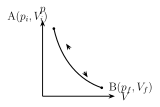
On a p-V diagram, a reversible process traces a path that is retraced exactly, in the opposite direction, when the process is reversed — the forward path (e.g. a reversible expansion) and the backward path (e.g. the corresponding reversible compression) are literally the same curve, run in opposite directions. Such changes must occur extremely slowly (quasi-statically), with no energy lost to friction or other dissipative effects along the way, so that the system returns to precisely its initial state when the reverse path is followed. Because of these strict requirements, reversible processes are best understood as idealised, limiting cases — every real thermodynamic process encounters at least some loss due to friction, viscosity, or other dissipative forces, and so is, strictly speaking, irreversible to some degree. …
Drawn by us to help you understand the concept clearly, and verified to make sure it's accurate. For exams, practice from your textbook's own diagram.
What this p-V diagram shows. The graph plots pressure p (vertical axis) against volume V (horizontal axis); the area under the curve equals the work done during the process, and the shape of the path tells you how pressure and volume change tog …
Drawn by us to help you understand the concept clearly, and verified to make sure it's accurate. For exams, practice from your textbook's own diagram.
What this p-V diagram shows. The graph plots pressure p (vertical axis) against volume V (horizontal axis); the area under the curve equals the work done during the process, and the shape of the path tells you how pressure and volume change tog …