Physics · Ch 4 — Thermodynamics
Work Done During a Thermodynamic Process
Work Done During a Thermodynamic Process
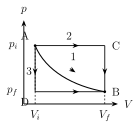
Consider a system that starts at state , with coordinates on a p-V diagram, and ends at state , with coordinates , where and . There are many different paths — many different sequences of intermediate states — by which the system could be taken from to ; three representative ones illustrate the point.
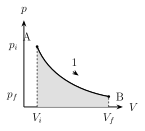
Path 1 is a single smooth curve directly connecting to , along which both pressure and volume change together continuously. Because the volume increases throughout, the work done by the system along this path is positive, and its value is given by the area under this curve.
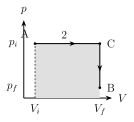
Path 2 takes a two-step, L-shaped route through an intermediate corner state : first the volume increases from to at the constant pressure (a horizontal leg from to ), and only then does the pressure fall from to at the now-constant volume (a vertical leg from to ). Since a constant-volume leg contributes no work at all (Section 4.6.3), the total work done along path 2 is just the rectangular area under the horizontal leg, at the higher pressure .
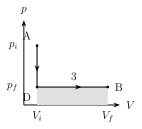
Path 3 takes the mirror-image two-step route: first the pressure falls from to at the constant volume (a vertical leg), and only then does the volume increase from to at the now-constant, lower pressure (a horizontal leg). Again the vertical leg contributes nothing, so the total work is the rectangular area under the horizontal leg — but this time swept out at the lower pressure , giving a visibly smaller work value than path 2. …
Drawn by us to help you understand the concept clearly, and verified to make sure it's accurate. For exams, practice from your textbook's own diagram.
What this p-V diagram shows. The graph plots pressure p (vertical axis) against volume V (horizontal axis); the area under the curve equals the work done during the process, and the shape of the path tells you how pressure and volume change tog …
Drawn by us to help you understand the concept clearly, and verified to make sure it's accurate. For exams, practice from your textbook's own diagram.
What this p-V diagram shows. The graph plots pressure p (vertical axis) against volume V (horizontal axis); the area under the curve equals the work done during the process, and the shape of the path tells you how pressure and volume change tog …
Drawn by us to help you understand the concept clearly, and verified to make sure it's accurate. For exams, practice from your textbook's own diagram.
What this p-V diagram shows. The graph plots pressure p (vertical axis) against volume V (horizontal axis); the area under the curve equals the work done during the process, and the shape of the path tells you how pressure and volume change tog …
Drawn by us to help you understand the concept clearly, and verified to make sure it's accurate. For exams, practice from your textbook's own diagram.
What this p-V diagram shows. The graph plots pressure p (vertical axis) against volume V (horizontal axis); the area under the curve equals the work done during the process, and the shape of the path tells you how pressure and volume change tog …