Physics · Ch 4 — Thermodynamics
Isobaric Process
Isobaric Process
An isobaric process is one that occurs at constant pressure, so . Water boiling at a fixed (typically atmospheric) pressure is the standard everyday example.
Work done. Since pressure is constant, it can be pulled outside the work integral , giving simply:
using the ideal gas equation to rewrite in terms of temperature change, where and are the system's initial and final temperature-volume pairs.
Change in internal energy. The change in internal energy is given generally, at constant volume-heat-capacity, by
where is the molar specific heat at constant volume, and .
Heat exchanged. Applying the First Law, , and substituting Eqs. (4.10) and (4.11):
Defining as the molar specific heat at constant pressure, this simplifies to:
So in an isobaric process, unlike an isothermal one, the temperature genuinely changes (), and consequently so does the internal energy (Eq. 4.11); the heat added (Eq. 4.12) is 'used' for two things at once — part of it raises the system's temperature/internal energy, and part of it goes into doing work as the gas expands or contracts. How this heat splits between the two depends on the value of : gases with a larger need more heat input for a given temperature rise, since more of that heat is 'competing' to also do work. …
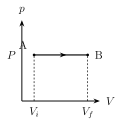
Drawn by us to help you understand the concept clearly, and verified to make sure it's accurate. For exams, practice from your textbook's own diagram.
What this p-V diagram shows. The graph plots pressure p (vertical axis) against volume V (horizontal axis); the area under the curve equals the work done during the process, and the shape of the path tells you how pressure and volume change tog …