Physics · Ch 4 — Thermodynamics
Cyclic Process
Cyclic Process
A cyclic process is one that eventually returns a system to its original starting state — the initial state and the final state of the overall process are identical. Because the system ends exactly where it began, the total change in internal energy over one complete cycle is zero:
Applying the First Law, , with gives immediately:
So over one complete cycle, the total net heat absorbed by the system exactly equals the total net work it does — a very useful simplification, since it means you don't need to track internal energy at all when analysing a full cyclic process, only the net heat and work.
On a p-V diagram, a cyclic process traces a closed loop: the system moves from an initial state along one curve to some other state, and then moves back to the initial state along a different curve, closing the loop. The enclosed area of this loop gives the net work done over one complete cycle — and the sense in which the loop is traversed determines the sign of that net work: if the loop is traversed clockwise, the net work done is positive (the system does net positive work on its surroundings over the cycle); if traversed counter-clockwise, the net work done is negative (net work is done ON the system over the cycle, and correspondingly, since , net heat must be rejected by the system over the cycle rather than absorbed). …
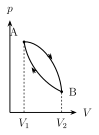
Drawn by us to help you understand the concept clearly, and verified to make sure it's accurate. For exams, practice from your textbook's own diagram.
What this p-V diagram shows. The graph plots pressure p (vertical axis) against volume V (horizontal axis); the area under the curve equals the work done during the process, and the shape of the path tells you how pressure and volume change tog …