Physics · Ch 4 — Thermodynamics
Isochoric Process
Isochoric Process
An isochoric process (also called an isovolumic process) occurs at constant volume, so . Two familiar examples are heating a gas that is sealed inside a rigid, fixed-volume container, and the diffusion of a gas within a closed chamber whose volume cannot change.
Since the volume never changes, the system does no work at all:
Applying the First Law, , with :
And, as in the isobaric case, the change in internal energy for a fixed volume-heat-capacity is
The physical picture is simple and direct: since the system does no work, every joule of heat added in an isochoric process goes entirely into raising the system's internal energy (and hence its temperature) — none of it is 'diverted' into doing work, unlike in an isobaric process. The temperature of the system does genuinely change () in an isochoric process — only the volume is held fixed. …
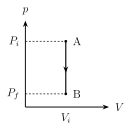
Drawn by us to help you understand the concept clearly, and verified to make sure it's accurate. For exams, practice from your textbook's own diagram.
What this p-V diagram shows. The graph plots pressure p (vertical axis) against volume V (horizontal axis); the area under the curve equals the work done during the process, and the shape of the path tells you how pressure and volume change tog …