The marks obtained by 50 students in a test are grouped as follows. Draw the less-than ogive for this distribution and use it to estimate the median mark. Also state, without drawing it in full, how a more-than ogive for the same data would look different, and how it could be used together with the less-than ogive to find the median.
| Marks | 0–10 | 10–20 | 20–30 | 30–40 | 40–50 |
|---|---|---|---|---|---|
| Number of students | 4 | 10 | 16 | 14 | 6 |
You're viewing a preview — the full solution, concept, methods & PYQ mapping are locked.
Start your 14-day free trial to unlock the full solution →Step 1 — Build the less-than cumulative frequency table.
| Marks (less than) | 10 | 20 | 30 | 40 | 50 |
|---|---|---|---|---|---|
| Cumulative frequency | 4 | 14 | 30 | 44 | 50 |
Check: matches the total cumulative frequency of at the last point.
Step 2 — Draw the less-than ogive. Plot and join consecutively with straight line segments.
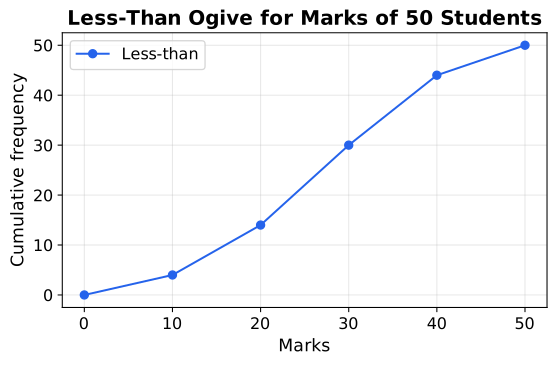
Step 3 — Locate on the curve. , so , which falls between the plotted points and .
Step 4 — Interpolate along that segment. The segment rises by in cumulative frequency as marks rise by . To rise from to (an increase of ) requires extra marks beyond . So the median is at .
Independent check (interpolation-formula form).
matching Step 4 exactly. …
Unlock everything free for 14 days
- Full step-by-step solutions
- Concept-first explanations
- Methods, shortcuts & mistakes
- PYQ mapping + timed mock tests
Full access for 14 days. No credit card required.